IOI with DAS#
![]()
__author__ = "Zhengxuan Wu"
__version__ = "12/31/2023"
Overview#
This tutorial aims to replicate key findings from previous mechanistic interpretability papers that examine the IOI task using this library. It focuses on identifying alignments for the name position information and the output IO name at various locations within the neural networks.
Additionally, the tutorial seeks to provide new insights into GPT-2’s causal mechanisms in solving this task by analyzing how information is stored and processed across different attention heads.
Set-up#
try:
    # This library is our indicator that the required installs
    # need to be done.
    import pyvene

except ModuleNotFoundError:
    !pip install git+https://github.com/stanfordnlp/pyvene.git
import random
import pandas as pd
from tutorial_ioi_utils import *
from pyvene import embed_to_distrib, top_vals, format_token, sigmoid_boundary
from pyvene import (
    IntervenableModel,
    RepresentationConfig,
    IntervenableConfig,
    LowRankRotatedSpaceIntervention,
    SkipIntervention,
    VanillaIntervention,
    BoundlessRotatedSpaceIntervention,
)
from pyvene import create_gpt2_lm

import matplotlib.pyplot as plt

%config InlineBackend.figure_formats = ['svg']
from plotnine import (
    ggplot,
    geom_tile,
    aes,
    facet_wrap,
    theme,
    element_text,
    geom_bar,
    geom_hline,
    scale_y_log10,
    scale_y_reverse,
    scale_fill_cmap,
    geom_text,
    scale_fill_gradient,
    geom_point,
    geom_line,
    theme_minimal,
    ylim,
    ggtitle,
    ggsave,
    labs,
    scale_x_discrete,
    geom_histogram,
    scale_fill_manual,
)

# please try not to do this, the plot somehow throw warnings though :(
import warnings

warnings.filterwarnings("ignore")

config, tokenizer, gpt2 = create_gpt2_lm()
_ = gpt2.eval().to("cuda" if torch.cuda.is_available() else "cpu")
loaded model
Factual recall#
We first check IOI task performance of GPT-2.
transformers.set_seed(42)
tokenizer.pad_token = tokenizer.eos_token

def get_last_token(logits, attention_mask):
    last_token_indices = attention_mask.sum(1) - 1
    batch_indices = torch.arange(logits.size(0)).unsqueeze(1)
    return logits[batch_indices, last_token_indices.unsqueeze(1)].squeeze(1)

train_distribution = PromptDistribution(
    names=NAMES[: len(NAMES) // 2],
    objects=OBJECTS[: len(OBJECTS) // 2],
    places=PLACES[: len(PLACES) // 2],
    templates=TEMPLATES_PATH,
)

D_train = train_distribution.sample_das(
    tokenizer=tokenizer,
    base_patterns=["ABB", "BAB"],
    source_patterns=["ABB", "BAB"],
    labels="position",
    samples_per_combination=50,
)

total_count = 0
correct_count = 0
with torch.no_grad():
    for batch_dataset in D_train.batches(batch_size=30):
        inputs = batch_dataset.base.tokens

        for k, v in inputs.items():
            if v is not None and isinstance(v, torch.Tensor):
                inputs[k] = v.to(gpt2.device)
        labels = batch_dataset.base.answer_tokens[:, 0].to(gpt2.device)

        outputs = gpt2(**inputs)
        logits = get_last_token(outputs.logits, inputs["attention_mask"]).unsqueeze(1)

        pred_labels = logits.argmax(dim=-1)[:, -1]
        correct_labels = labels == pred_labels

        total_count += len(correct_labels)
        correct_count += correct_labels.sum().tolist()
current_acc = round(correct_count / total_count, 2)
print(f"gpt-2 IOI task accuracy: {current_acc}")
gpt-2 IOI task accuracy: 0.91
Localizing the name position information in the main residual stream and MLP activations#
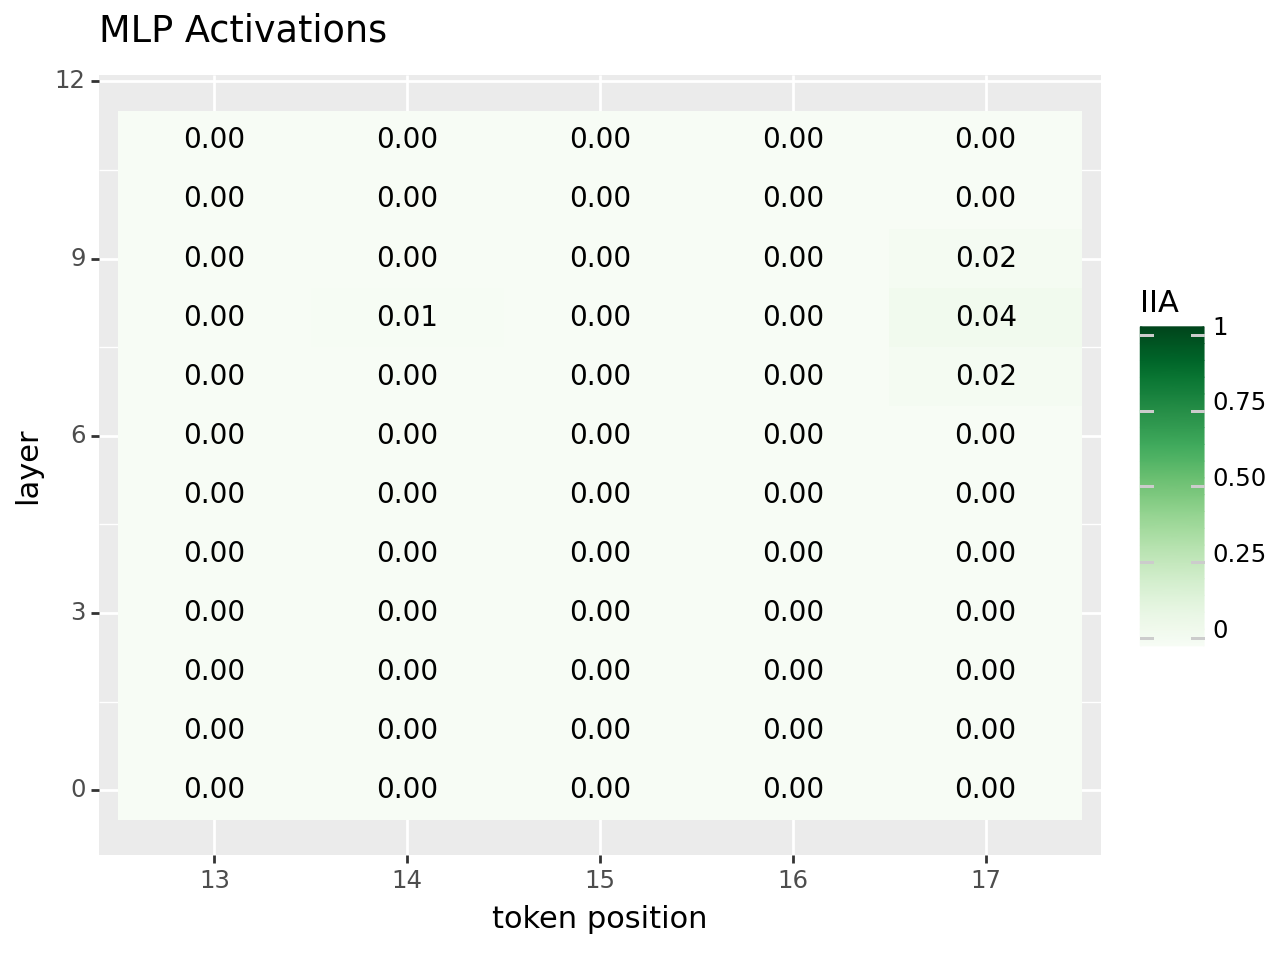
This section reproduces main results in this paper. To address the IOI task, previous studies have shown that GPT-2 creates representations for a causal variable representing the correct name position (either the first or second name mentioned in a sentence). Our objective is to utilize our library to pinpoint the location of name position information at each layer and across several positions, not just at the last token position.
block_out_data = find_variable_at(
    gpt2,
    tokenizer,
    positions=[13, 14, 15, 16, 17],
    layers=[i for i in range(12)],
    stream="block_output",
    aligning_variable="position",
    debug=True,
)
finding name position at: pos->13, layers->0, stream->block_output
---------------------------------------------------------------------------
AssertionError                            Traceback (most recent call last)
Cell In [5], line 1
----> 1 block_out_data = find_variable_at(
      2     gpt2,
      3     tokenizer,
      4     positions=[13, 14, 15, 16, 17],
      5     layers=[i for i in range(12)],
      6     stream="block_output",
      7     aligning_variable="position",
      8     debug=True,
      9 )

File ~/Documents/Code/pyvene/tutorials/advanced_tutorials/tutorial_ioi_utils.py:704, in find_variable_at(gpt2, tokenizer, positions, layers, stream, heads, low_rank_dimension, aligning_variable, do_vanilla_intervention, do_boundless_das, seed, return_intervenable, debug)
    699 # prepare label
    700 labels = batch_dataset.patched_answer_tokens[:, 0].to(
    701     gpt2.device
    702 )
--> 704 assert all(x == 18 for x in batch_dataset.base.lengths)
    705 assert all(x == 18 for x in batch_dataset.source.lengths)
    707 if heads is not None:

AssertionError:
# these lines are comment out since we have run the experiments.
# df = pd.DataFrame(block_out_data)
# df.to_csv("./tutorial_data/block_out_df.csv")
df = pd.read_csv("./tutorial_data/block_out_df.csv")
df["layer"] = df["layer"].astype(int)
df["token position"] = df["pos"].astype(int)
df["IIA"] = df["acc"].astype(float)
df["token position"] = df["token position"].astype("category")

# Use format string to keep two decimal places
df["IIA_label"] = df["IIA"].apply(lambda x: f"{x:.2f}")

block_out_plot = (
    ggplot(df, aes(x="token position", y="layer"))
    + geom_tile(aes(fill="IIA"))
    + scale_fill_cmap("Purples", limits=[0, 1])
    + geom_text(aes(label="IIA_label"), color="black", size=10)
    + ggtitle("Main Residual Streams")
)
ggsave(block_out_plot, filename="./tutorial_data/block_out_plot.pdf", dpi=200)
block_out_plot

<Figure Size: (640 x 480)>
mlp_activation_data = find_variable_at(
    gpt2,
    tokenizer,
    positions=[13, 14, 15, 16, 17],
    layers=[i for i in range(12)],
    stream="mlp_activation",
    aligning_variable="position",
    debug=True,
)
# df = pd.DataFrame(mlp_activation_data)
# df.to_csv("./tutorial_data/mlp_activation_df.csv")
df = pd.read_csv("./tutorial_data/mlp_activation_df.csv")
df["layer"] = df["layer"].astype(int)
df["token position"] = df["pos"].astype(int)
df["IIA"] = df["acc"].astype(float)
df["token position"] = df["token position"].astype("category")

# Use format string to keep two decimal places
df["IIA_label"] = df["IIA"].apply(lambda x: f"{x:.2f}")

mlp_activaiton_plot = (
    ggplot(df, aes(x="token position", y="layer"))
    + geom_tile(aes(fill="IIA"))
    + scale_fill_cmap("Greens", limits=[0, 1])
    + geom_text(aes(label="IIA_label"), color="black", size=10)
    + ggtitle("MLP Activations")
)
ggsave(mlp_activaiton_plot, filename="./tutorial_data/mlp_activaiton_plot.pdf", dpi=200)
mlp_activaiton_plot
<Figure Size: (640 x 480)>
Localizing in across multiple tokens at layer 7, one layer earlier than layer 8#
block_out_across_tokens_data = find_variable_at(
    gpt2,
    tokenizer,
    [[0, 1, 2, 3, 4, 5, 6, 7, 8, 9, 10, 11, 12, 13, 14, 15, 16]],
    [7],
    "block_output",
    aligning_variable="position",
    debug=True,
)
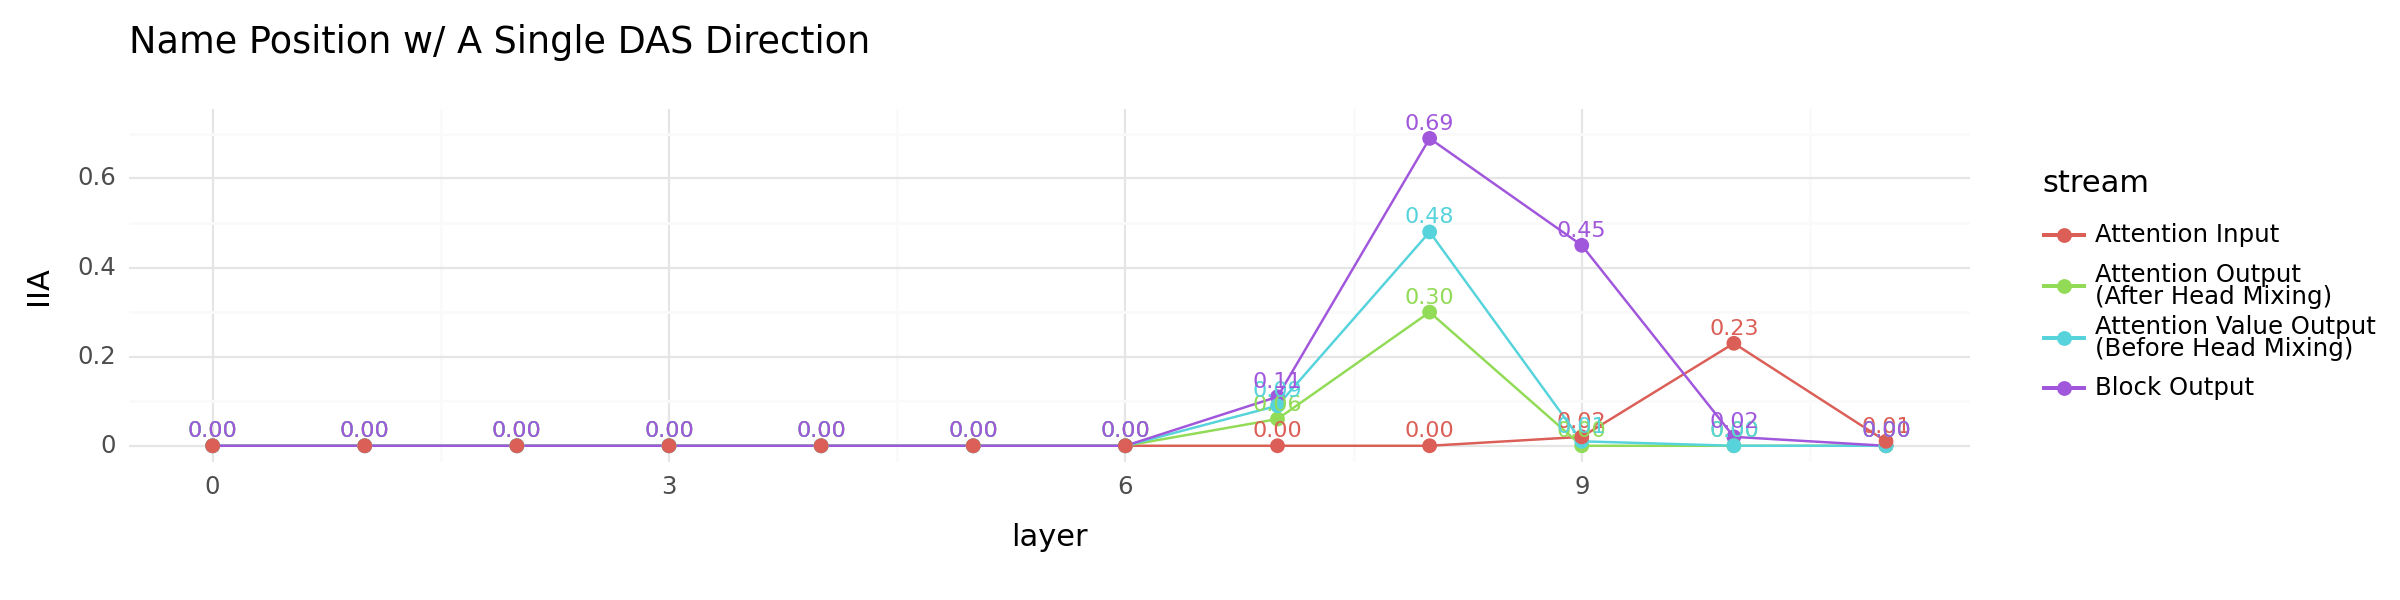
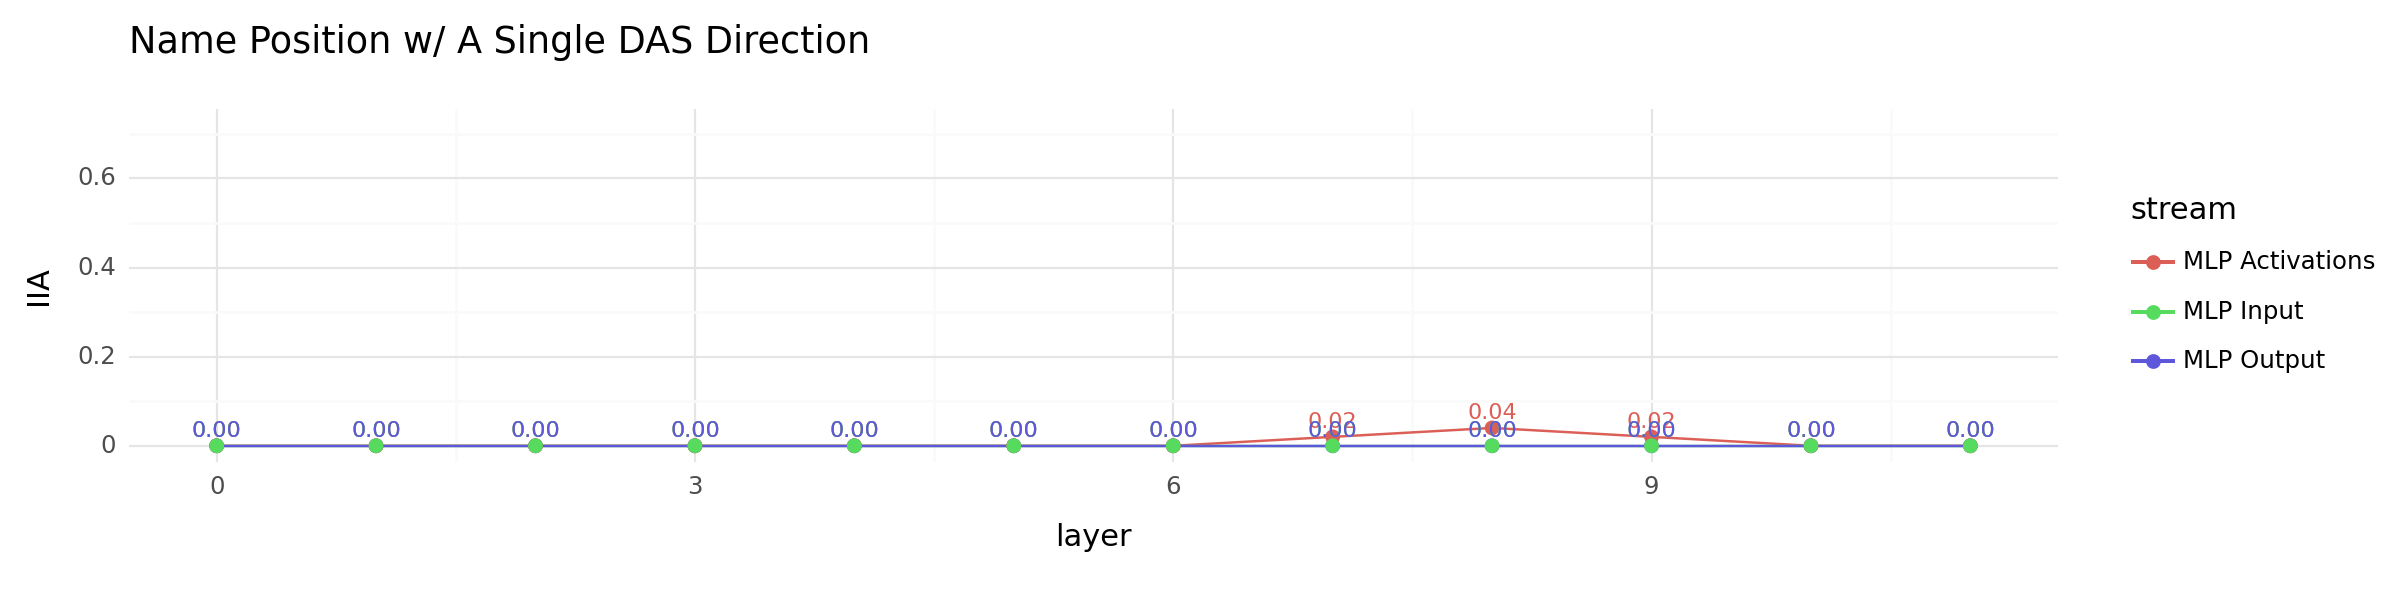
Localizing in different streams#
attn_input_data = find_variable_at(
    gpt2, tokenizer, [17], [i for i in range(12)], "attention_input", debug=True
)
block_input_data = find_variable_at(
    gpt2, tokenizer, [17], [i for i in range(12)], "block_input", debug=True
)
mlp_input_data = find_variable_at(
    gpt2, tokenizer, [17], [i for i in range(12)], "mlp_input", debug=True
)
mlp_act_data = find_variable_at(
    gpt2, tokenizer, [17], [i for i in range(12)], "mlp_activation", debug=True
)
attn_out_data = find_variable_at(
    gpt2, tokenizer, [17], [i for i in range(12)], "attention_output", debug=True
)
mlp_out_data = find_variable_at(
    gpt2, tokenizer, [17], [i for i in range(12)], "mlp_output", debug=True
)
attn_value_out_data = find_variable_at(
    gpt2, tokenizer, [17], [i for i in range(12)], "attention_value_output", debug=True
)
block_output_data = find_variable_at(
    gpt2, tokenizer, [17], [i for i in range(12)], "block_output", debug=True
)
all_streams_df = pd.read_csv("./tutorial_data/all_streams_df.csv")
all_streams_df["IIA"] = all_streams_df["acc"]
df = all_streams_df[
    all_streams_df["stream"].isin(
        {
            "block_output",
            "attention_input",
            "attention_output",
            "attention_value_output",
        }
    )
].copy()
stream_labels = {
    "block_output": "Block Output",
    "attention_input": "Attention Input",
    "attention_output": "Attention Output\n(After Head Mixing)",
    "attention_value_output": "Attention Value Output\n(Before Head Mixing)",
}
df.loc[:, "stream"] = df["stream"].replace(stream_labels)


def custom_format(x):
    return f"{x:.2f}"


df.loc[:, "IIA_formatted"] = df["IIA"].map(custom_format)
other_locations_plot = (
    ggplot(df, aes(x="layer", y="IIA", color="stream"))
    + geom_line()
    + geom_point(size=2)
    + geom_text(
        aes(label="IIA_formatted"), nudge_y=0.01, size=8, va="bottom", show_legend=False
    )
    + theme_minimal()
    + ylim(0, 0.72)
    + theme(figure_size=(12, 3))
    + ggtitle("Name Position w/ A Single DAS Direction")
)

ggsave(
    other_locations_plot, filename="./tutorial_data/other_locations_plot.pdf", dpi=200
)
other_locations_plot
<Figure Size: (1200 x 300)>
# all_streams_df = pd.DataFrame(
#     block_output_data+attn_out_data+
#     mlp_out_data+attn_value_out_data+
#     mlp_act_data+mlp_input_data+
#     block_input_data+attn_input_data
# )
# all_streams_df.to_csv("./tutorial_data/all_streams_df.csv")
all_streams_df = pd.read_csv("./tutorial_data/all_streams_df.csv")
all_streams_df["IIA"] = all_streams_df["acc"]
df = all_streams_df[
    all_streams_df["stream"].isin({"mlp_output", "mlp_input", "mlp_activation"})
].copy()
stream_labels = {
    "mlp_output": "MLP Output",
    "mlp_input": "MLP Input",
    "mlp_activation": "MLP Activations",
}
df["stream"] = df["stream"].replace(stream_labels)


def custom_format(x):
    return f"{x:.2f}"


df["IIA_formatted"] = df["IIA"].apply(custom_format)
all_mlp_locations_plot = (
    ggplot(df, aes(x="layer", y="IIA", color="stream"))
    + geom_line()
    + geom_point(size=2)
    + geom_text(
        aes(label="IIA_formatted"), nudge_y=0.01, size=8, va="bottom", show_legend=False
    )
    + theme_minimal()
    + ylim(0, 0.72)
    + theme(figure_size=(12, 3))
    + ggtitle("Name Position w/ A Single DAS Direction")
)

ggsave(
    all_mlp_locations_plot,
    filename="./tutorial_data/all_mlp_locations_plot.pdf",
    dpi=200,
)
all_mlp_locations_plot
<Figure Size: (1200 x 300)>
Localizing in each individual head at layer 7 and 8#
We further investigate whether any heads in the 7th and 8th layers specialize in name position information. Note that we consider each head individually in this analysis. Therefore, if the name position information is distributed across tokens, it would not be detectable in this context.
head_attn_value_out_data = []
for h in range(12):
    _head_attn_value_out_data = find_variable_at(
        gpt2, tokenizer, [17], [7, 8], "head_attention_value_output", [h]
    )
    head_attn_value_out_data.extend(_head_attn_value_out_data)
df = pd.DataFrame(head_attn_value_out_data)

plot = (
    ggplot(df, aes(x="layer", y="acc", color="stream"))
    + geom_line()
    + geom_point(size=2)
    + theme_minimal()
    + ylim(0, 1)
)

print(plot)
Localizing with group of heads using rankings of missing out head IIA#
When examining each individual head, localizing the name position information was not possible. Why is this? The information is likely distributed across multiple heads. To further investigate, let’s perform an additional check by localizing in the concatenated head representations, leaving only one head out at a time. We leave one head out to determine if omitting specific heads results in significant drops in IIA.
layer = 7

head_attn_value_out_mo_data = []
for i in range(12):
    print("evaluating grouped IIA without head", i)
    _head_attn_value_out_mo_data = find_variable_at(
        gpt2,
        tokenizer,
        [17],
        [layer],
        "head_attention_value_output",
        heads=list(set([i for i in range(12)]) - {i}),
    )[0]
    _head_attn_value_out_mo_data["mo_head"] = i
    head_attn_value_out_mo_data += [_head_attn_value_out_mo_data]
head_rank_list = []
anchor_acc = 0.48
for data in head_attn_value_out_mo_data:
    head_rank_list += [(data["mo_head"], anchor_acc - data["acc"])]
head_rank_list = sorted(head_rank_list, key=lambda x: x[1], reverse=True)
df = pd.DataFrame(head_attn_value_out_mo_data)
df["mo_head_cat"] = pd.Categorical(
    df["mo_head"], categories=df["mo_head"].unique(), ordered=True
)
head_drop_plot = (
    ggplot(df, aes(x="mo_head_cat", y="acc", fill="mo_head"))
    + geom_bar(stat="identity", position="dodge", width=0.9)
    + labs(x=f"Leave-One-Out (LOO) Head Index ({layer}th Layer)", y="IIA")
    + theme_minimal()  # Add axis labels
    + theme(figure_size=(10, 2))  # Use a minimal theme
    + theme(legend_position="none")
    + scale_x_discrete(labels=[f"head {i}" for i in df["mo_head"]])
)

ggsave(
    head_drop_plot,
    filename=f"./tutorial_data/layer_{layer}_head_drop_plot.pdf",
    dpi=200,
)
head_drop_plot
head_attn_value_out_cumulative_data = []
current_heads = []
for i in head_rank_list:
    current_heads += [i[0]]
    print("evaluating grouped IIA adding head", i[0])
    _head_attn_value_out_cumulative_data = find_variable_at(
        gpt2,
        tokenizer,
        [17],
        [layer],
        "head_attention_value_output",
        heads=current_heads,
    )[0]
    _head_attn_value_out_cumulative_data["adding_head"] = i[0]
    head_attn_value_out_cumulative_data += [_head_attn_value_out_cumulative_data]
df = pd.DataFrame(head_attn_value_out_cumulative_data)
df["adding_head_cat"] = pd.Categorical(
    df["adding_head"], categories=df["adding_head"].unique(), ordered=True
)

head_acc_plot = (
    ggplot(df, aes(x="adding_head_cat", y="acc", fill="adding_head"))
    + geom_bar(stat="identity", position="dodge", width=0.9)
    + labs(x=f"Cumulative Head Index ({layer}th Layer)", y="IIA")
    + theme_minimal()  # Add axis labels
    + theme(figure_size=(10, 2))  # Use a minimal theme
    + theme(legend_position="none")
    + scale_x_discrete(labels=[f"+ head {i}" for i in df["adding_head"]])
)

ggsave(
    head_acc_plot, filename=f"./tutorial_data/layer_{layer}_head_acc_plot.pdf", dpi=200
)
head_acc_plot
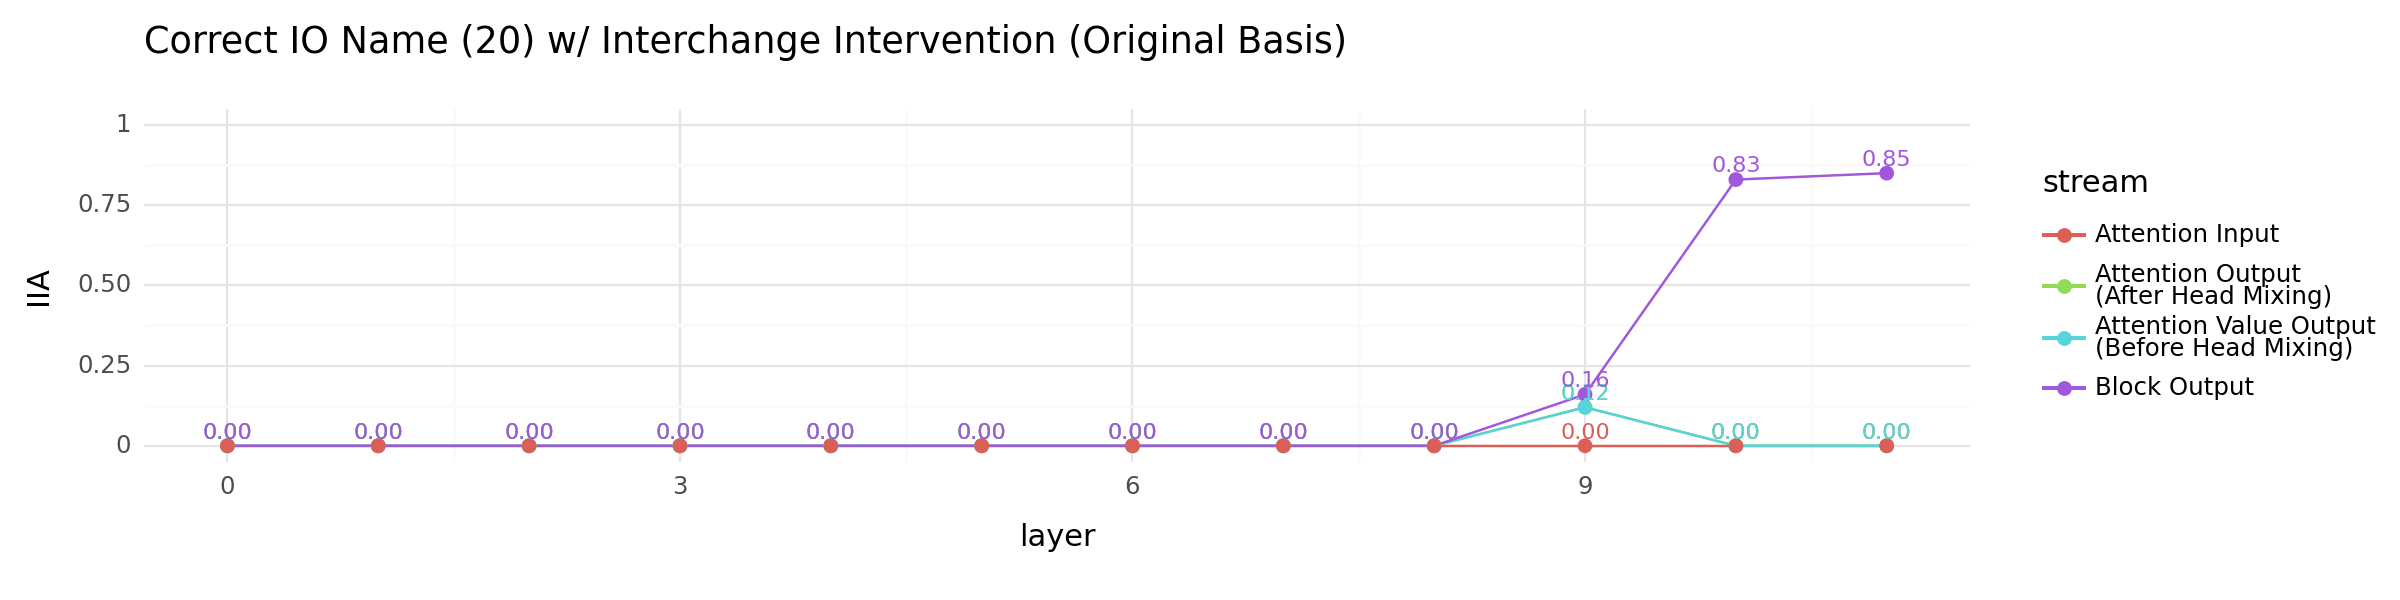
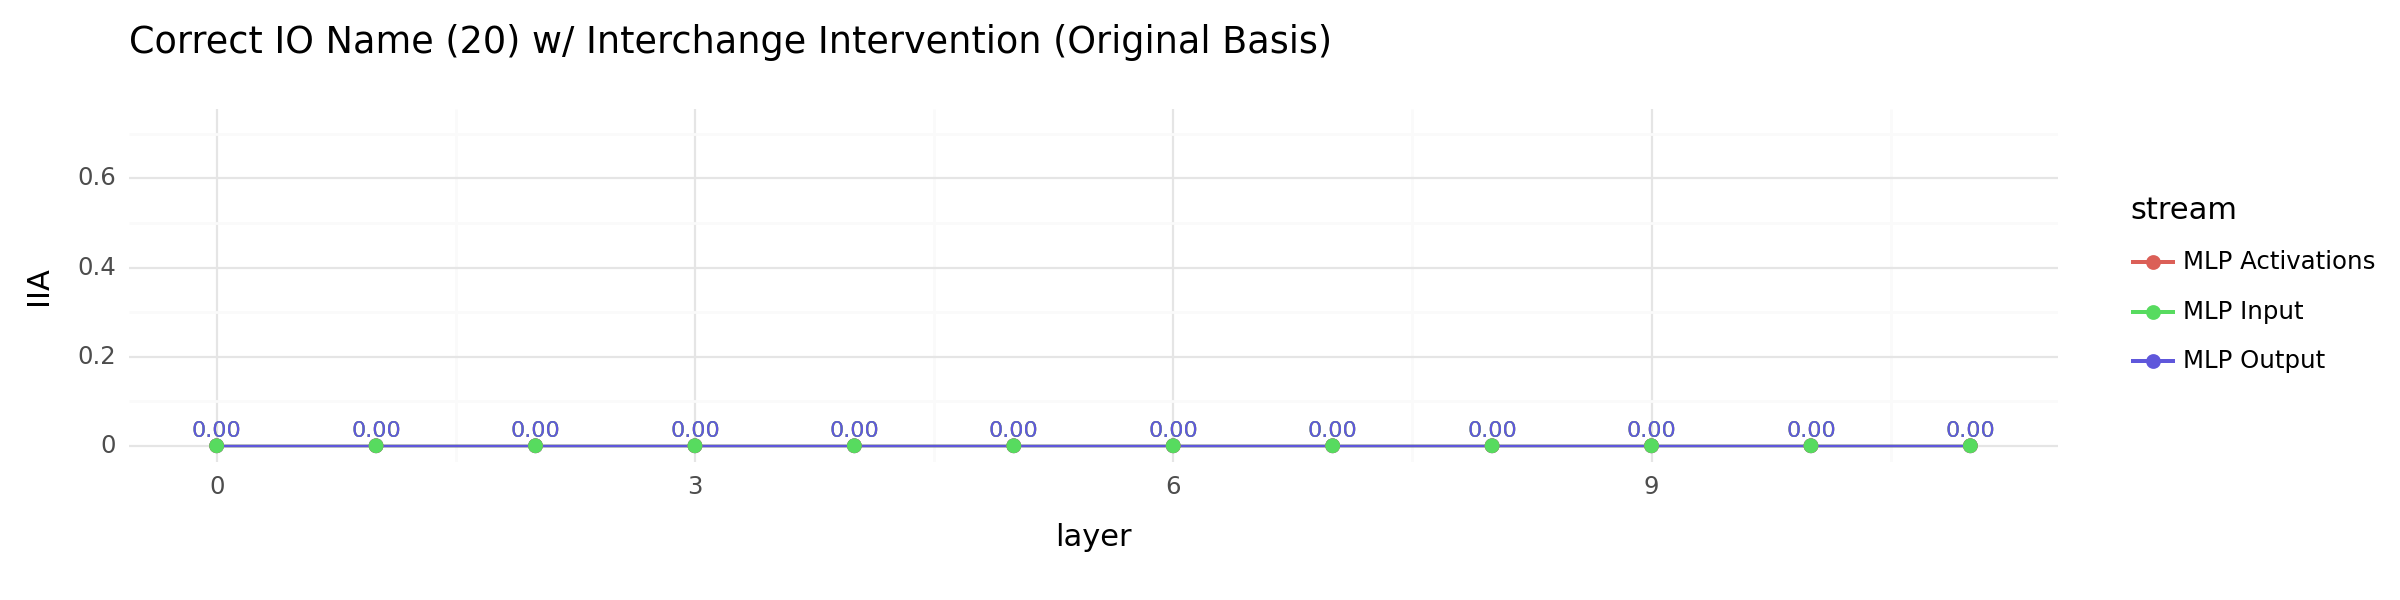
Localizing the correct IO name with vanilla causal abstraction (no training)#
We can further localize the correct IO name in the output streams. We use vanilla interchange intervention, so there is no training just activation swap.
attn_input_data = find_variable_at(
    gpt2,
    tokenizer,
    [17],
    [i for i in range(12)],
    "attention_input",
    aligning_variable="name",  # now we are localizing the IO name
    do_vanilla_intervention=True,  # we avoid learning DAS for this since outspace is large here.
    debug=False,
)
block_input_data = find_variable_at(
    gpt2,
    tokenizer,
    [17],
    [i for i in range(12)],
    "block_input",
    aligning_variable="name",
    do_vanilla_intervention=True,
    debug=False,
)
mlp_input_data = find_variable_at(
    gpt2,
    tokenizer,
    [17],
    [i for i in range(12)],
    "mlp_input",
    aligning_variable="name",
    do_vanilla_intervention=True,
    debug=False,
)
mlp_act_data = find_variable_at(
    gpt2,
    tokenizer,
    [17],
    [i for i in range(12)],
    "mlp_activation",
    aligning_variable="name",
    do_vanilla_intervention=True,
    debug=False,
)
attn_out_data = find_variable_at(
    gpt2,
    tokenizer,
    [17],
    [i for i in range(12)],
    "attention_output",
    aligning_variable="name",
    do_vanilla_intervention=True,
    debug=False,
)
mlp_out_data = find_variable_at(
    gpt2,
    tokenizer,
    [17],
    [i for i in range(12)],
    "mlp_output",
    aligning_variable="name",
    do_vanilla_intervention=True,
    debug=False,
)
attn_value_out_data = find_variable_at(
    gpt2,
    tokenizer,
    [17],
    [i for i in range(12)],
    "attention_value_output",
    aligning_variable="name",
    do_vanilla_intervention=True,
    debug=False,
)
block_output_data = find_variable_at(
    gpt2,
    tokenizer,
    [17],
    [i for i in range(12)],
    "block_output",
    aligning_variable="name",
    do_vanilla_intervention=True,
    debug=False,
)
all_streams_df = pd.DataFrame(
    block_output_data
    + attn_out_data
    + mlp_out_data
    + attn_value_out_data
    + mlp_act_data
    + mlp_input_data
    + block_input_data
    + attn_input_data
)
all_streams_df["IIA"] = all_streams_df["acc"]
df = all_streams_df[
    all_streams_df["stream"].isin(
        {
            "block_output",
            "attention_input",
            "attention_output",
            "attention_value_output",
        }
    )
].copy()
stream_labels = {
    "block_output": "Block Output",
    "attention_input": "Attention Input",
    "attention_output": "Attention Output\n(After Head Mixing)",
    "attention_value_output": "Attention Value Output\n(Before Head Mixing)",
}
df["stream"] = df["stream"].replace(stream_labels)


def custom_format(x):
    return f"{x:.2f}"


df["IIA_formatted"] = df["IIA"].apply(custom_format)
other_locations_plot = (
    ggplot(df, aes(x="layer", y="IIA", color="stream"))
    + geom_line()
    + geom_point(size=2)
    + geom_text(
        aes(label="IIA_formatted"), nudge_y=0.01, size=8, va="bottom", show_legend=False
    )
    + theme_minimal()
    + ylim(0, 1)
    + theme(figure_size=(12, 3))
    + ggtitle("Correct IO Name (20) w/ Interchange Intervention (Original Basis)")
)
ggsave(
    other_locations_plot,
    filename="./tutorial_data/IO_name_other_locations_plot.pdf",
    dpi=200,
)
other_locations_plot
<Figure Size: (1200 x 300)>
all_streams_df["IIA"] = all_streams_df["acc"]
df = all_streams_df[
    all_streams_df["stream"].isin({"mlp_output", "mlp_input", "mlp_activation"})
]
stream_labels = {
    "mlp_output": "MLP Output",
    "mlp_input": "MLP Input",
    "mlp_activation": "MLP Activations",
}
df["stream"] = df["stream"].replace(stream_labels)


def custom_format(x):
    return f"{x:.2f}"


df["IIA_formatted"] = df["IIA"].apply(custom_format)
all_mlp_locations_plot = (
    ggplot(df, aes(x="layer", y="IIA", color="stream"))
    + geom_line()
    + geom_point(size=2)
    + geom_text(
        aes(label="IIA_formatted"), nudge_y=0.01, size=8, va="bottom", show_legend=False
    )
    + theme_minimal()
    + ylim(0, 0.72)
    + theme(figure_size=(12, 3))
    + ggtitle("Correct IO Name (20) w/ Interchange Intervention (Original Basis)")
)
ggsave(
    all_mlp_locations_plot,
    filename="./tutorial_data/IO_name_all_mlp_locations_plot.pdf",
    dpi=200,
)
all_mlp_locations_plot
<Figure Size: (1200 x 300)>
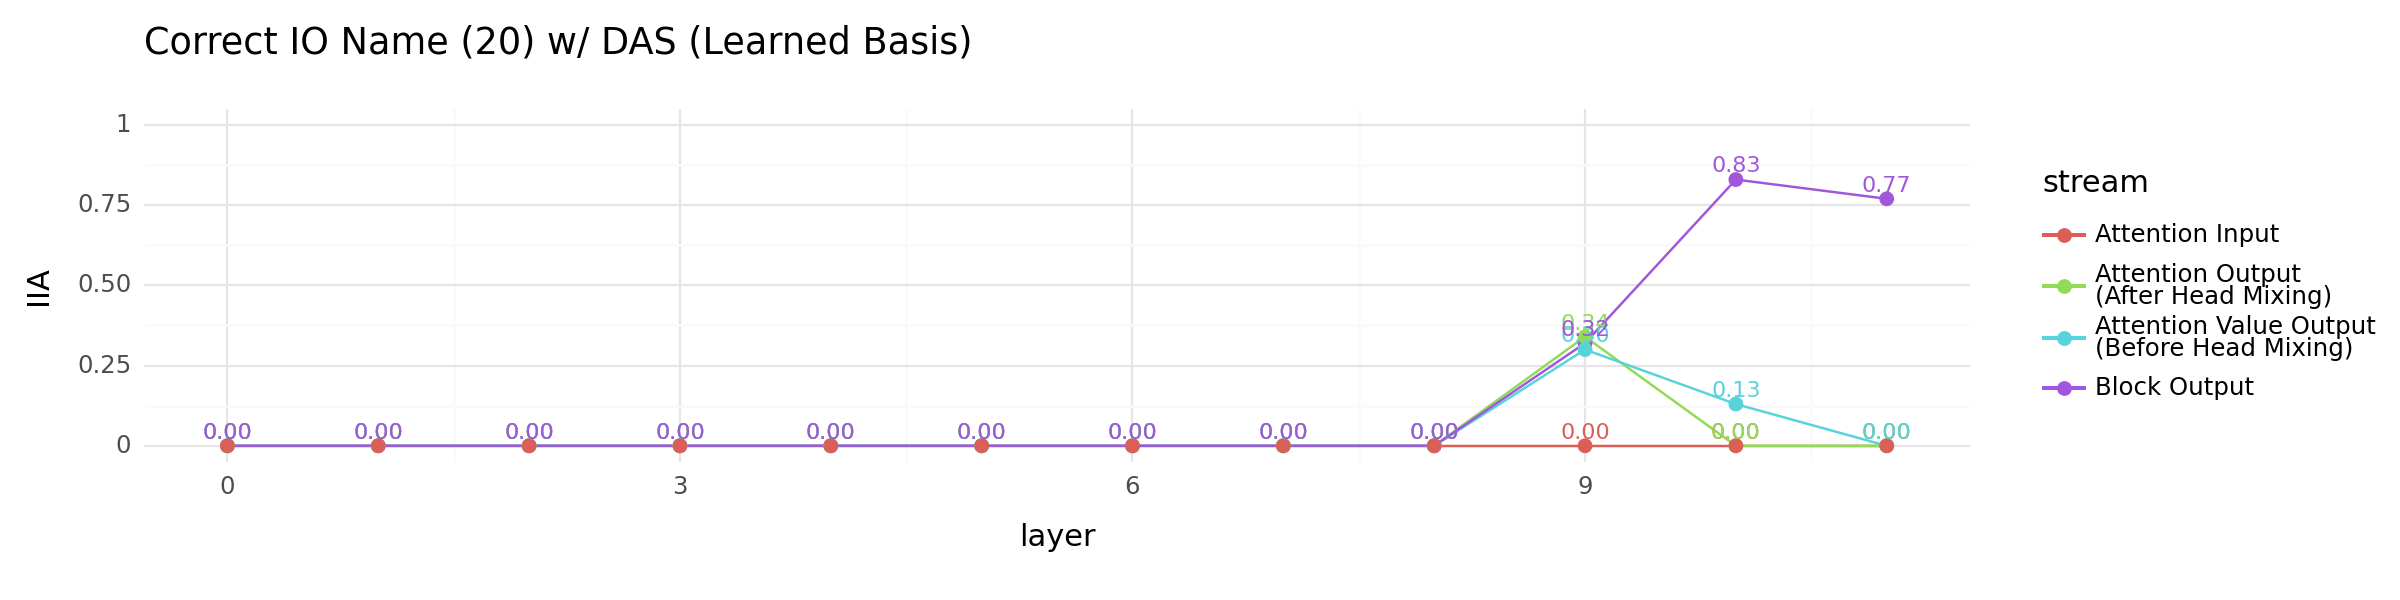
Localizing the correct IO name with DAS (20 names only with 20 dimension DAS)#
We now localize the IO name with DAS. To make things easier, we restrict the dataset to contain 20 distinct names. Training and evaluation share the same set of names. We use a fixed dimension size of 20 for DAS training. Everything else is kept the same as previous experiments.
attn_input_data = find_variable_at(
    gpt2,
    tokenizer,
    [17],
    [i for i in range(12)],
    "attention_input",
    low_rank_dimension=20,
    aligning_variable="name",  # now we are localizing the IO name
    debug=False,
)
block_input_data = find_variable_at(
    gpt2,
    tokenizer,
    [17],
    [i for i in range(12)],
    "block_input",
    low_rank_dimension=20,
    aligning_variable="name",
    debug=False,
)
mlp_input_data = find_variable_at(
    gpt2,
    tokenizer,
    [17],
    [i for i in range(12)],
    "mlp_input",
    low_rank_dimension=20,
    aligning_variable="name",
    debug=False,
)
mlp_act_data = find_variable_at(
    gpt2,
    tokenizer,
    [17],
    [i for i in range(12)],
    "mlp_activation",
    low_rank_dimension=20,
    aligning_variable="name",
    debug=False,
)
attn_out_data = find_variable_at(
    gpt2,
    tokenizer,
    [17],
    [i for i in range(12)],
    "attention_output",
    low_rank_dimension=20,
    aligning_variable="name",
    debug=False,
)
mlp_out_data = find_variable_at(
    gpt2,
    tokenizer,
    [17],
    [i for i in range(12)],
    "mlp_output",
    low_rank_dimension=20,
    aligning_variable="name",
    debug=False,
)
attn_value_out_data = find_variable_at(
    gpt2,
    tokenizer,
    [17],
    [i for i in range(12)],
    "attention_value_output",
    low_rank_dimension=20,
    aligning_variable="name",
    debug=False,
)
block_output_data = find_variable_at(
    gpt2,
    tokenizer,
    [17],
    [i for i in range(12)],
    "block_output",
    low_rank_dimension=20,
    aligning_variable="name",
    debug=False,
)
# all_streams_io_name_df = pd.DataFrame(
#     block_output_data+
#     attn_out_data+mlp_out_data+
#     attn_value_out_data+mlp_act_data+
#     mlp_input_data+block_input_data+attn_input_data
# )
# all_streams_io_name_df.to_csv("./tutorial_data/all_streams_io_name_df.csv")
all_streams_io_name_df = pd.read_csv("./tutorial_data/all_streams_io_name_df.csv")
all_streams_io_name_df["IIA"] = all_streams_io_name_df["acc"]
df = all_streams_io_name_df[
    all_streams_io_name_df["stream"].isin(
        {
            "block_output",
            "attention_input",
            "attention_output",
            "attention_value_output",
        }
    )
].copy()
stream_labels = {
    "block_output": "Block Output",
    "attention_input": "Attention Input",
    "attention_output": "Attention Output\n(After Head Mixing)",
    "attention_value_output": "Attention Value Output\n(Before Head Mixing)",
}
df["stream"] = df["stream"].replace(stream_labels)


def custom_format(x):
    return f"{x:.2f}"


df["IIA_formatted"] = df["IIA"].apply(custom_format)
other_locations_plot = (
    ggplot(df, aes(x="layer", y="IIA", color="stream"))
    + geom_line()
    + geom_point(size=2)
    + geom_text(
        aes(label="IIA_formatted"), nudge_y=0.01, size=8, va="bottom", show_legend=False
    )
    + theme_minimal()
    + ylim(0, 1)
    + theme(figure_size=(12, 3))
    + ggtitle("Correct IO Name (20) w/ DAS (Learned Basis)")
)
ggsave(
    other_locations_plot,
    filename="./tutorial_data/DAS_IO_name_other_locations_plot.pdf",
    dpi=200,
)
other_locations_plot
<Figure Size: (1200 x 300)>
# all_streams_df = pd.DataFrame(
# block_output_data+attn_out_data+
# mlp_out_data+attn_value_out_data+
# mlp_act_data+mlp_input_data+
# block_input_data+attn_input_data
# )
# all_streams_df.to_csv("./tutorial_data/all_streams_df.csv")
all_streams_io_name_df = pd.read_csv("./tutorial_data/all_streams_io_name_df.csv")
all_streams_io_name_df["IIA"] = all_streams_io_name_df["acc"]
df = all_streams_io_name_df[
all_streams_io_name_df["stream"].isin({"mlp_output", "mlp_input", "mlp_activation"})
].copy()
stream_labels = {
"mlp_output": "MLP Output",
"mlp_input": "MLP Input",
"mlp_activation": "MLP Activations",
}
df["stream"] = df["stream"].replace(stream_labels)
def custom_format(x):
return f"{x:.2f}"
df["IIA_formatted"] = df["IIA"].apply(custom_format)
all_mlp_locations_plot = (
ggplot(df, aes(x="layer", y="IIA", color="stream"))
+ geom_line()
+ geom_point(size=2)
+ geom_text(
aes(label="IIA_formatted"), nudge_y=0.01, size=8, va="bottom", show_legend=False
)
+ theme_minimal()
+ ylim(0, 0.72)
+ theme(figure_size=(12, 3))
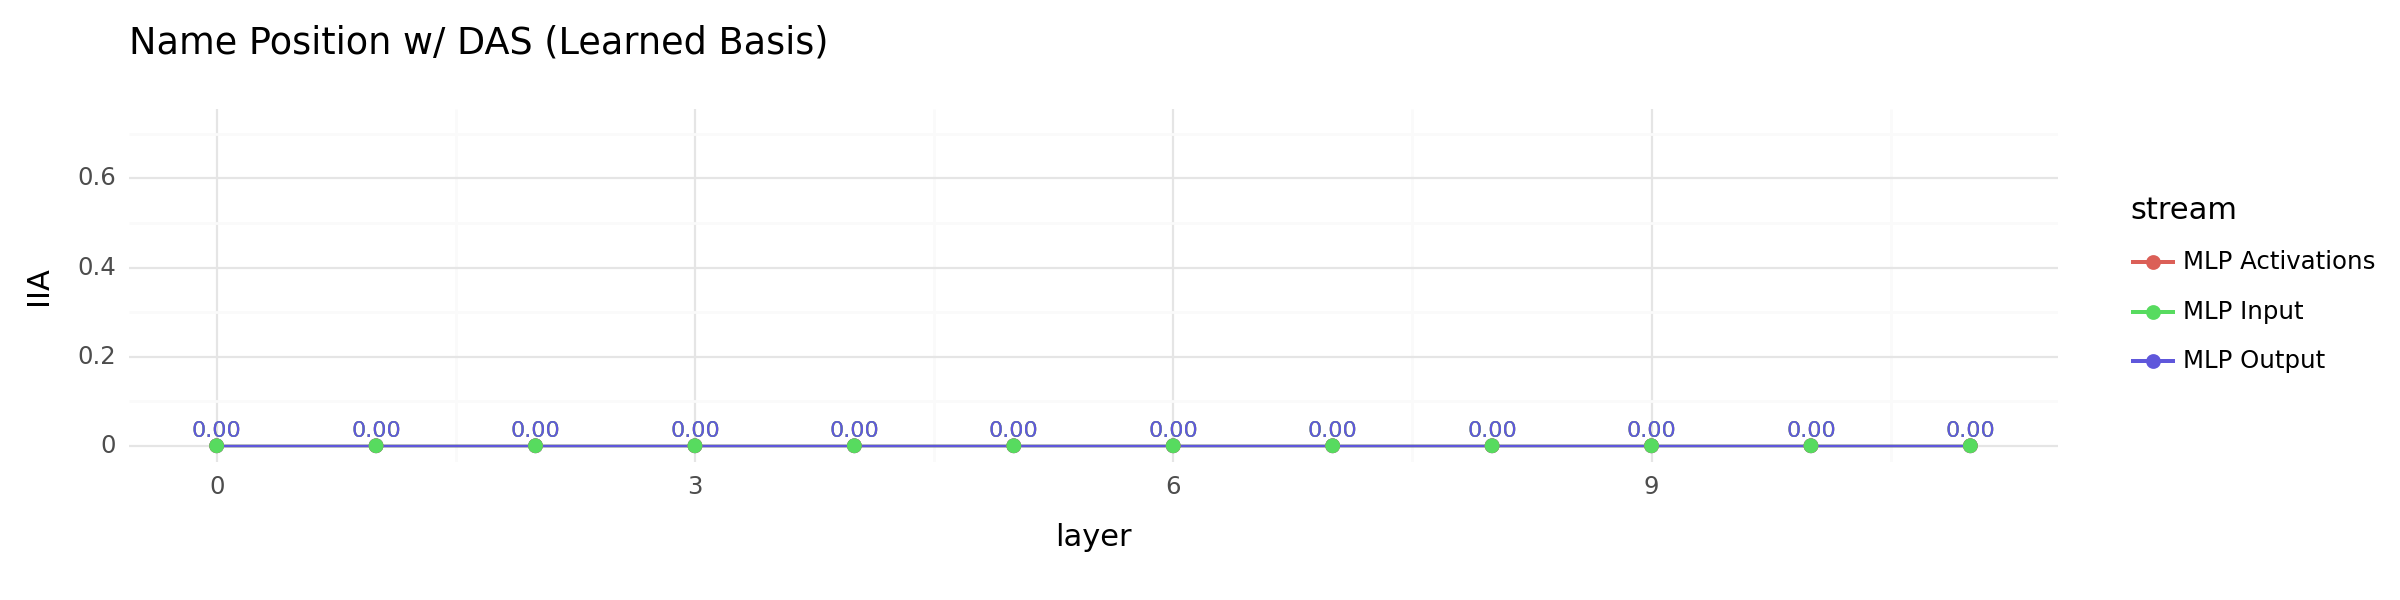
+ ggtitle("Name Position w/ DAS (Learned Basis)")
)
ggsave(
all_mlp_locations_plot,
filename="./tutorial_data/DAS_IO_name_all_mlp_locations_plot.pdf",
dpi=200,
)
all_mlp_locations_plot
<Figure Size: (1200 x 300)>
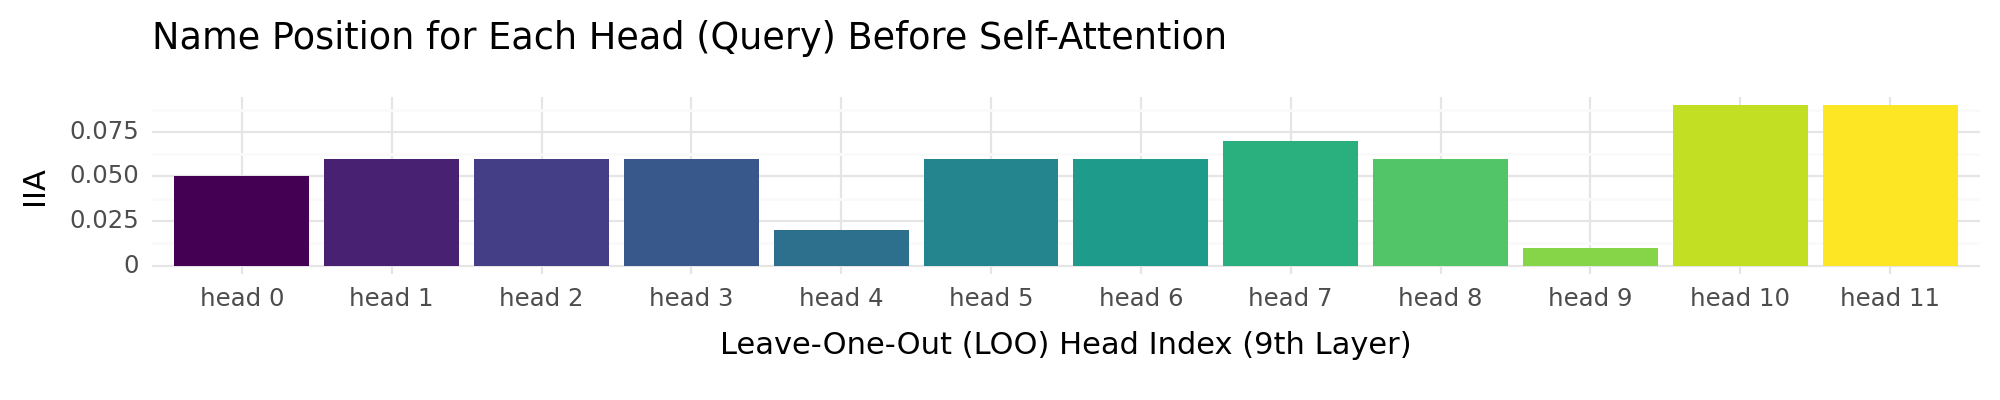
Head’s Query Representations to Trace Name Mover Head#
To use the name position information to copy the IO name, responsible heads need to take in name position information, and process it.
layer = 9
head_query_output_mo_data = []
for i in range(12):
    _head_query_output_mo_data = find_variable_at(
        gpt2,
        tokenizer,
        [17],
        [layer],
        "head_query_output",
        heads=sorted(list(set([i for i in range(12)]) - {i})),
        debug=True,
    )[0]
    _head_query_output_mo_data["mo_head"] = i
    head_query_output_mo_data.append(_head_query_output_mo_data)
layer = 9
# df = pd.DataFrame(head_query_output_mo_data)
# df.to_csv(f"./tutorial_data/layer_{layer}_head_query_output_mo_data.csv")
df = pd.read_csv(f"./tutorial_data/layer_{layer}_head_query_output_mo_data.csv")
df["mo_head_cat"] = pd.Categorical(
    df["mo_head"], categories=df["mo_head"].unique(), ordered=True
)
head_query_output_mo_plot = (
    ggplot(df, aes(x="mo_head_cat", y="acc", fill="mo_head"))
    + geom_bar(stat="identity", position="dodge", width=0.9)
    + labs(x=f"Leave-One-Out (LOO) Head Index ({layer}th Layer)", y="IIA")
    + theme_minimal()  # Add axis labels
    + theme(figure_size=(10, 2))  # Use a minimal theme
    + theme(legend_position="none")
    + scale_x_discrete(labels=[f"head {i}" for i in df["mo_head"]])
    + ggtitle("Name Position for Each Head (Query) Before Self-Attention")
)

ggsave(
    head_query_output_mo_plot,
    filename=f"./tutorial_data/layer_{layer}_head_query_output_mo_plot.pdf",
    dpi=200,
)
head_query_output_mo_plot
<Figure Size: (1000 x 200)>
head_attention_value_output_mo_data = []
for i in range(12):
    _head_attention_value_output_mo_data = find_variable_at(
        gpt2,
        tokenizer,
        [17],
        [layer],
        "head_attention_value_output",
        heads=sorted(list(set([i for i in range(12)]) - {i})),
        low_rank_dimension=20,
        aligning_variable="name",
        debug=True,
    )[0]
    _head_attention_value_output_mo_data["mo_head"] = i
    head_attention_value_output_mo_data.append(_head_attention_value_output_mo_data)
# df = pd.DataFrame(head_attention_value_output_mo_data)
# df.to_csv(f"./tutorial_data/layer_{layer}_head_attention_value_output_mo_data.csv")
df = pd.read_csv(
    f"./tutorial_data/layer_{layer}_head_attention_value_output_mo_data.csv"
)
df["mo_head_cat"] = pd.Categorical(
    df["mo_head"], categories=df["mo_head"].unique(), ordered=True
)
head_attention_value_output_mo_plot = (
    ggplot(df, aes(x="mo_head_cat", y="acc", fill="mo_head"))
    + geom_bar(stat="identity", position="dodge", width=0.9)
    + labs(x=f"Leave-One-Out (LOO) Head Index ({layer}th Layer)", y="IIA")
    + theme_minimal()  # Add axis labels
    + theme(figure_size=(10, 2))  # Use a minimal theme
    + theme(legend_position="none")
    + scale_x_discrete(labels=[f"head {i}" for i in df["mo_head"]])
    + ggtitle("IO Name for Each Head (Value) after Self-Attention")
)

ggsave(
    head_attention_value_output_mo_plot,
    filename=f"./tutorial_data/layer_{layer}_head_attention_value_output_mo_plot.pdf",
    dpi=200,
)
head_attention_value_output_mo_plot
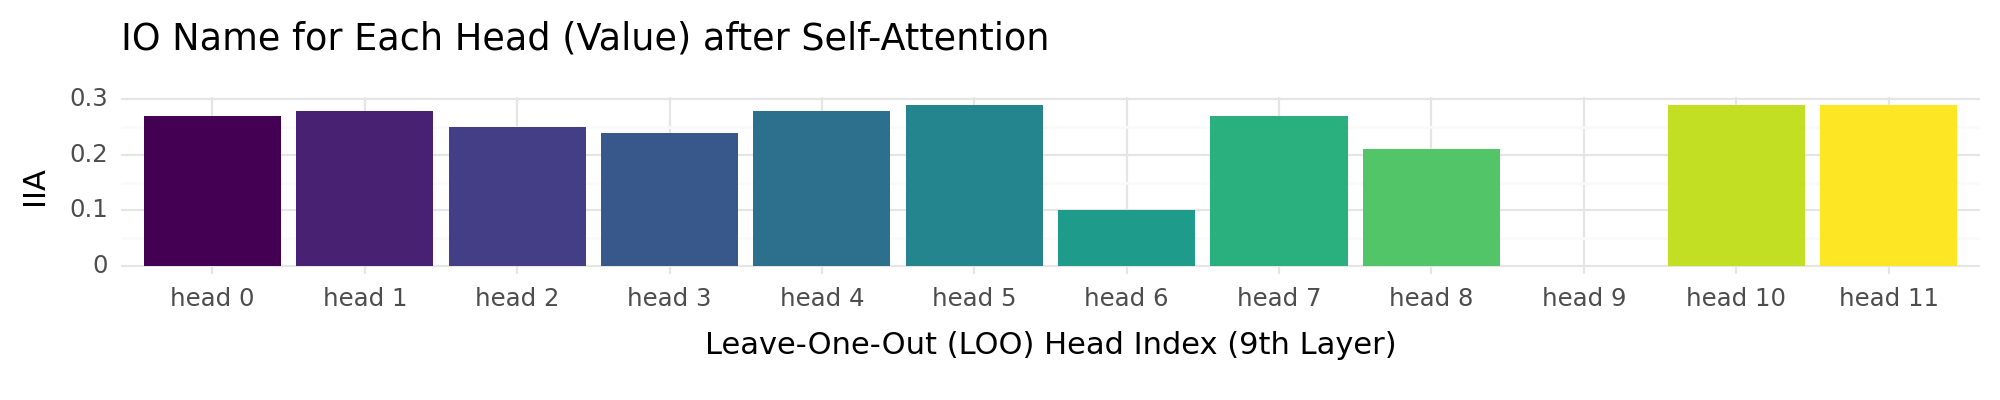
<Figure Size: (1000 x 200)>
head_attn_value_out_cumulative_data = []
current_heads = []
for i in [9, 6, 8, 3, 2, 7, 0, 1, 4, 11, 5, 10]:
    current_heads += [i]
    print("evaluating grouped IIA adding head", i)
    _head_attn_value_out_cumulative_data = find_variable_at(
        gpt2,
        tokenizer,
        [17],
        [layer],
        "head_attention_value_output",
        heads=sorted(current_heads),
        low_rank_dimension=20,
        aligning_variable="name",
        debug=True,
    )[0]
    _head_attn_value_out_cumulative_data["adding_head"] = i
    head_attn_value_out_cumulative_data += [_head_attn_value_out_cumulative_data]
# df = pd.DataFrame(head_attn_value_out_cumulative_data)
# df.to_csv(f"./tutorial_data/DAS_IO_layer_{layer}_head_attn_value_out_cumulative_data.csv")
df = pd.read_csv(
f"./tutorial_data/DAS_IO_layer_{layer}_head_attn_value_out_cumulative_data.csv"
)
df["adding_head_cat"] = pd.Categorical(
df["adding_head"], categories=df["adding_head"].unique(), ordered=True
)
head_acc_plot = (
ggplot(df, aes(x="adding_head_cat", y="acc", fill="adding_head"))
+ geom_bar(stat="identity", position="dodge", width=0.9)
+ labs(x=f"Cumulative Head Index ({layer}th Layer)", y="IIA")
+ theme_minimal() # Add axis labels
+ theme(figure_size=(10, 2)) # Use a minimal theme
+ theme(legend_position="none")
+ scale_x_discrete(labels=[f"+ head {i}" for i in df["adding_head"]])
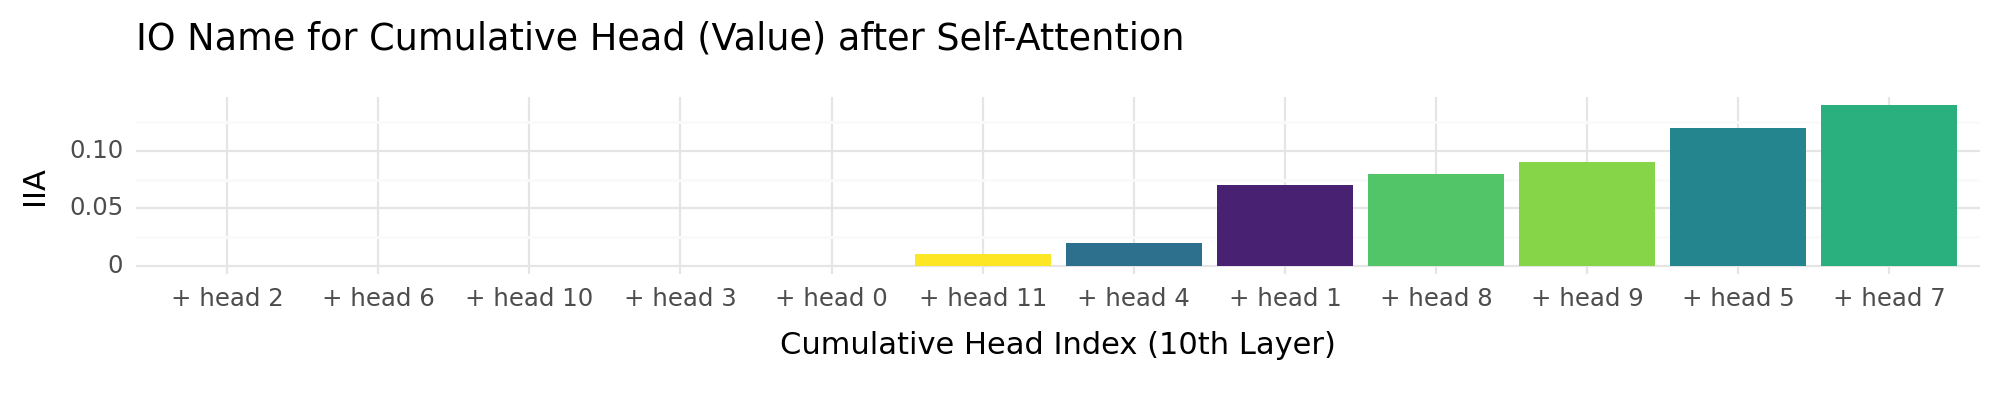
+ ggtitle("IO Name for Cumulative Head (Value) after Self-Attention")
)
ggsave(
head_acc_plot,
filename=f"./tutorial_data/DAS_IO_layer_{layer}_head_attn_value_out_cumulative_plot.pdf",
dpi=200,
)
head_acc_plot
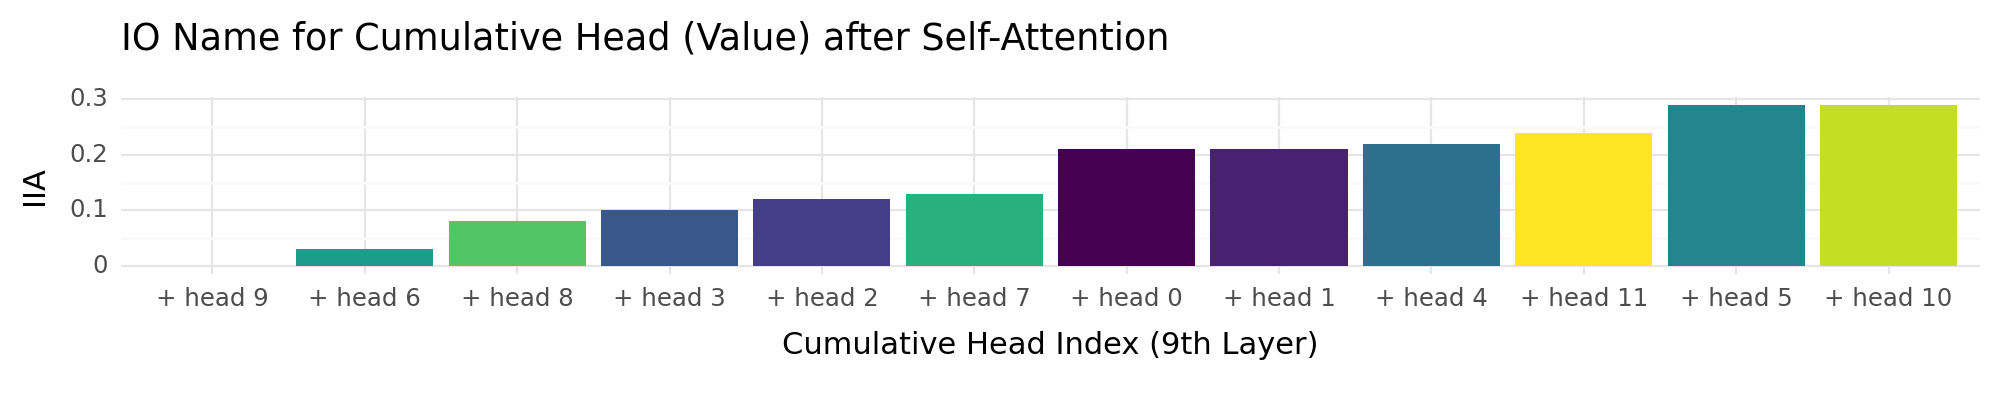
<Figure Size: (1000 x 200)>
layer = 10
head_query_output_mo_data = []
for i in range(12):
    _head_query_output_mo_data = find_variable_at(
        gpt2,
        tokenizer,
        [17],
        [layer],
        "head_query_output",
        heads=sorted(list(set([i for i in range(12)]) - {i})),
        debug=True,
    )[0]
    _head_query_output_mo_data["mo_head"] = i
    head_query_output_mo_data.append(_head_query_output_mo_data)
layer = 10
# df = pd.DataFrame(head_query_output_mo_data)
# df.to_csv(f"./tutorial_data/layer_{layer}_head_query_output_mo_data.csv")
df = pd.read_csv(f"./tutorial_data/layer_{layer}_head_query_output_mo_data.csv")
df["mo_head_cat"] = pd.Categorical(
    df["mo_head"], categories=df["mo_head"].unique(), ordered=True
)
head_query_output_mo_plot = (
    ggplot(df, aes(x="mo_head_cat", y="acc", fill="mo_head"))
    + geom_bar(stat="identity", position="dodge", width=0.9)
    + labs(x=f"Leave-One-Out (LOO) Head Index ({layer}th Layer)", y="IIA")
    + theme_minimal()  # Add axis labels
    + theme(figure_size=(10, 2))  # Use a minimal theme
    + theme(legend_position="none")
    + scale_x_discrete(labels=[f"head {i}" for i in df["mo_head"]])
    + ggtitle("Name Position for Each Head (Query) Before Self-Attention")
)

ggsave(
    head_query_output_mo_plot,
    filename=f"./tutorial_data/layer_{layer}_head_query_output_mo_plot.pdf",
    dpi=200,
)
head_query_output_mo_plot
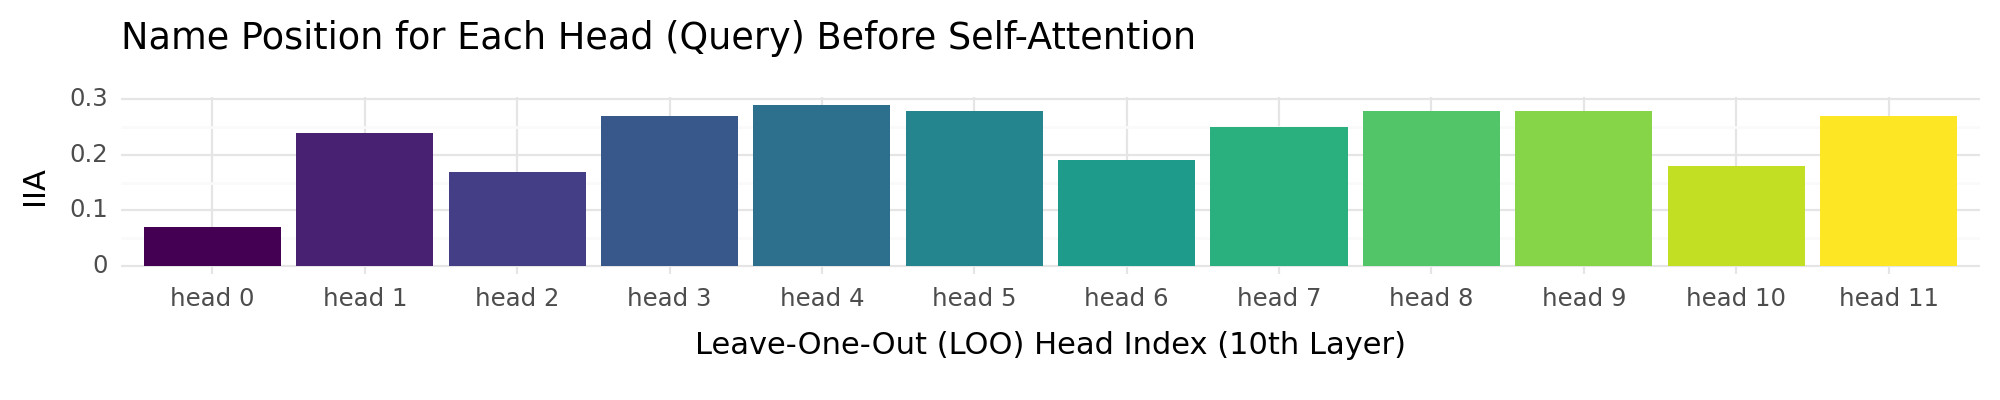
<Figure Size: (1000 x 200)>
head_attention_value_output_mo_data = []
for i in range(12):
    _head_attention_value_output_mo_data = find_variable_at(
        gpt2,
        tokenizer,
        [17],
        [layer],
        "head_attention_value_output",
        heads=sorted(list(set([i for i in range(12)]) - {i})),
        low_rank_dimension=20,
        aligning_variable="name",
        debug=True,
    )[0]
    _head_attention_value_output_mo_data["mo_head"] = i
    head_attention_value_output_mo_data.append(_head_attention_value_output_mo_data)
# df = pd.DataFrame(head_attention_value_output_mo_data)
# df.to_csv(f"./tutorial_data/layer_{layer}_head_attention_value_output_mo_data.csv")
df = pd.read_csv(
    f"./tutorial_data/layer_{layer}_head_attention_value_output_mo_data.csv"
)
df["mo_head_cat"] = pd.Categorical(
    df["mo_head"], categories=df["mo_head"].unique(), ordered=True
)
head_attention_value_output_mo_plot = (
    ggplot(df, aes(x="mo_head_cat", y="acc", fill="mo_head"))
    + geom_bar(stat="identity", position="dodge", width=0.9)
    + labs(x=f"Leave-One-Out (LOO) Head Index ({layer}th Layer)", y="IIA")
    + theme_minimal()  # Add axis labels
    + theme(figure_size=(10, 2))  # Use a minimal theme
    + theme(legend_position="none")
    + scale_x_discrete(labels=[f"head {i}" for i in df["mo_head"]])
    + ggtitle("IO Name for Each Head (Value) after Self-Attention")
)

ggsave(
    head_attention_value_output_mo_plot,
    filename=f"./tutorial_data/layer_{layer}_head_attention_value_output_mo_plot.pdf",
    dpi=200,
)
head_attention_value_output_mo_plot
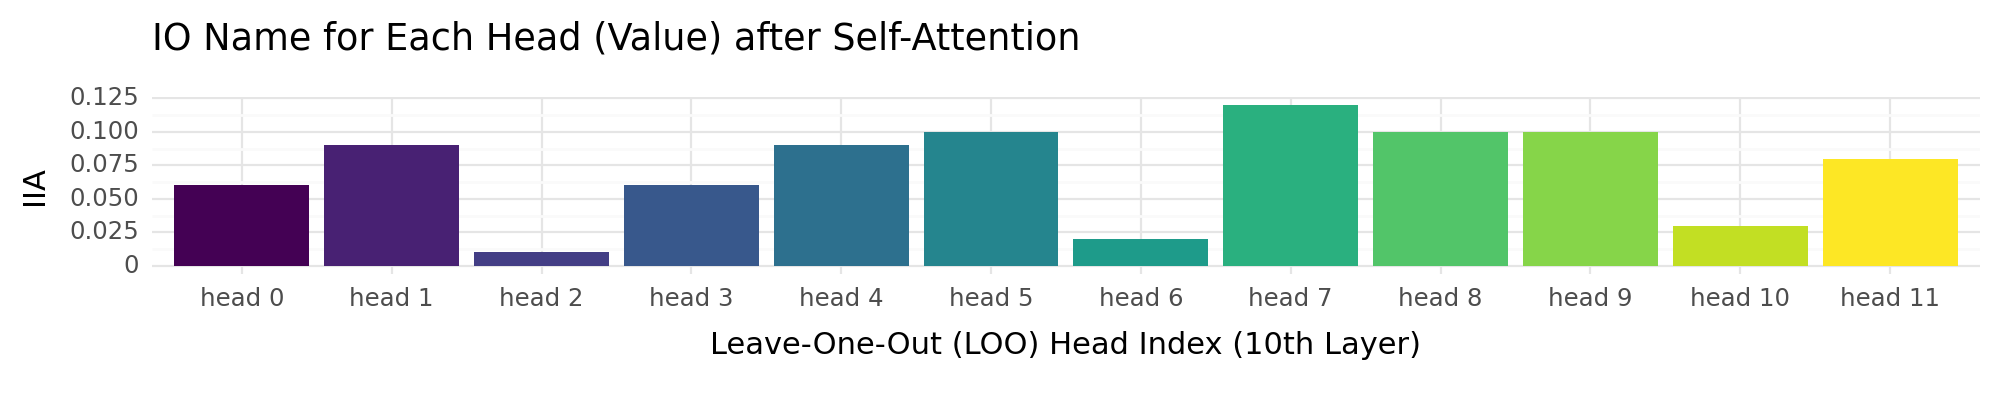
<Figure Size: (1000 x 200)>
head_attn_value_out_cumulative_data = []
current_heads = []
for i in [2, 6, 10, 3, 0, 11, 4, 1, 8, 9, 5, 7]:
    current_heads += [i]
    print("evaluating grouped IIA adding head", i)
    _head_attn_value_out_cumulative_data = find_variable_at(
        gpt2,
        tokenizer,
        [17],
        [layer],
        "head_attention_value_output",
        heads=sorted(current_heads),
        low_rank_dimension=20,
        aligning_variable="name",
        debug=True,
    )[0]
    _head_attn_value_out_cumulative_data["adding_head"] = i
    head_attn_value_out_cumulative_data += [_head_attn_value_out_cumulative_data]
# df = pd.DataFrame(head_attn_value_out_cumulative_data)
# df.to_csv(f"./tutorial_data/DAS_IO_layer_{layer}_head_attn_value_out_cumulative_data.csv")
df = pd.read_csv(
    f"./tutorial_data/DAS_IO_layer_{layer}_head_attn_value_out_cumulative_data.csv"
)
df["adding_head_cat"] = pd.Categorical(
    df["adding_head"], categories=df["adding_head"].unique(), ordered=True
)
head_acc_plot = (
    ggplot(df, aes(x="adding_head_cat", y="acc", fill="adding_head"))
    + geom_bar(stat="identity", position="dodge", width=0.9)
    + labs(x=f"Cumulative Head Index ({layer}th Layer)", y="IIA")
    + theme_minimal()  # Add axis labels
    + theme(figure_size=(10, 2))  # Use a minimal theme
    + theme(legend_position="none")
    + scale_x_discrete(labels=[f"+ head {i}" for i in df["adding_head"]])
    + ggtitle("IO Name for Cumulative Head (Value) after Self-Attention")
)

ggsave(
    head_acc_plot,
    filename=f"./tutorial_data/DAS_IO_layer_{layer}_head_attn_value_out_cumulative_plot.pdf",
    dpi=200,
)
head_acc_plot
<Figure Size: (1000 x 200)>
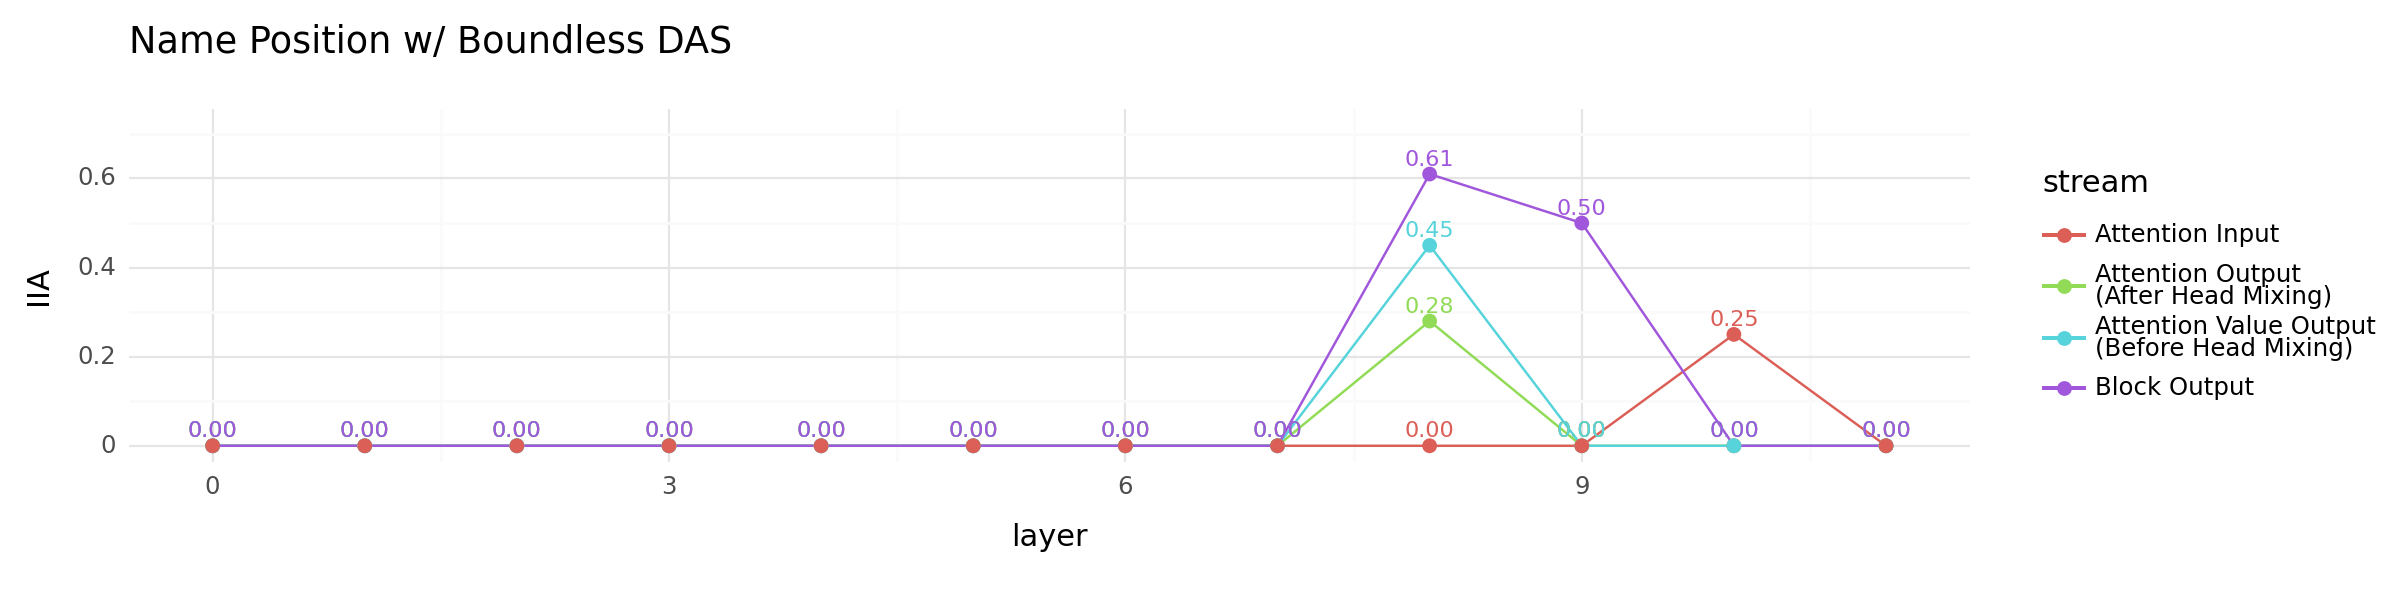
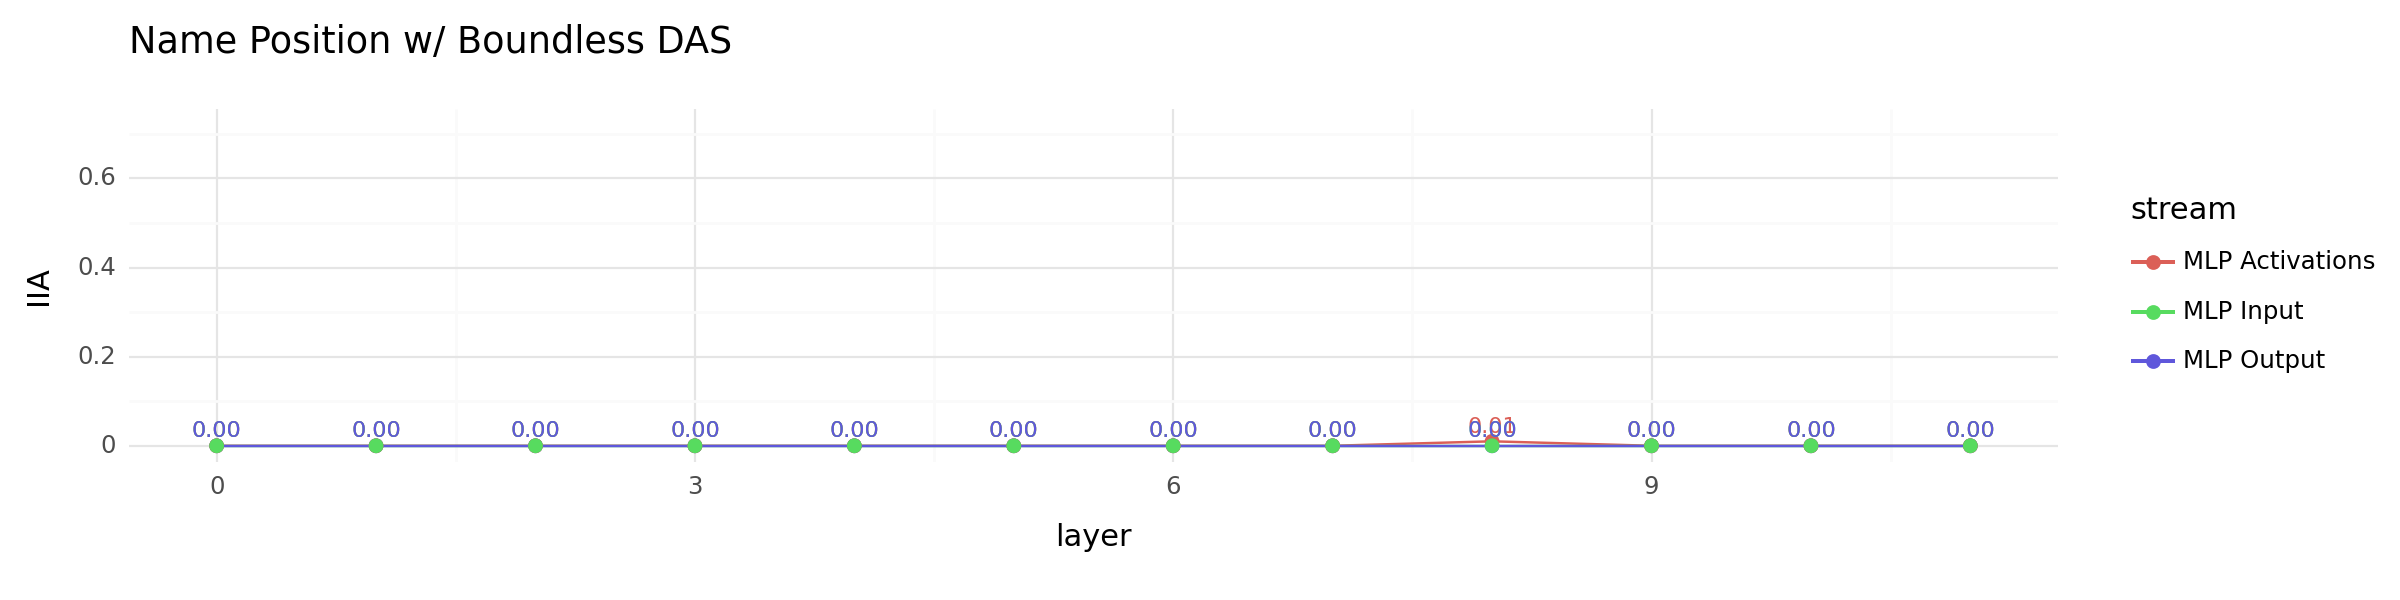
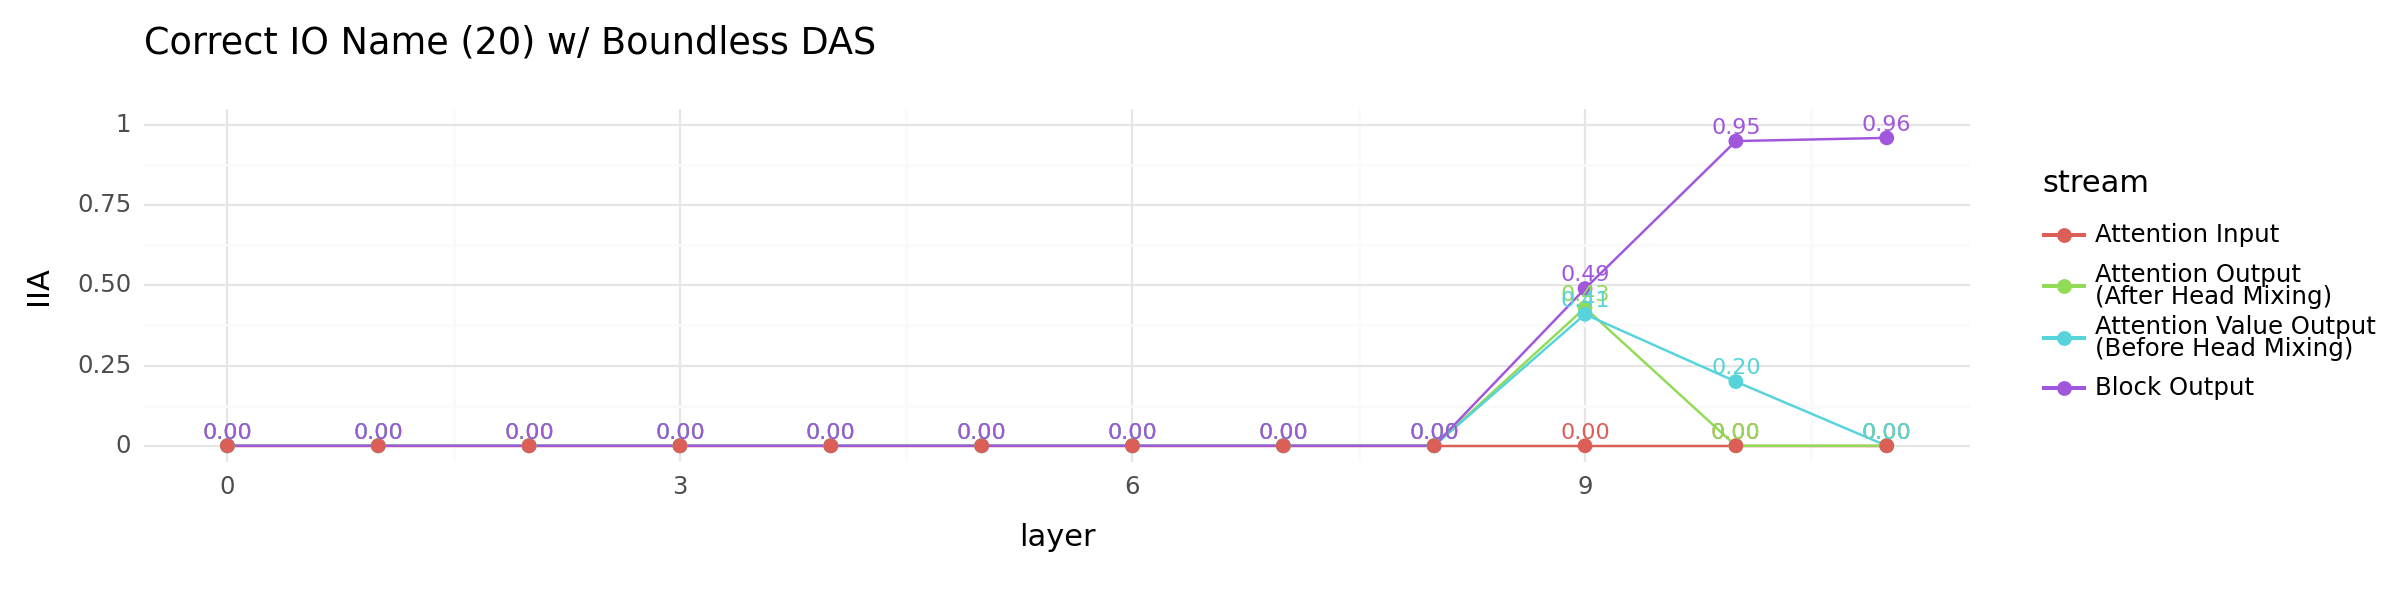
Use Boundless DAS to find information#
Instead of starting with a fixed number of DAS dimension, we can also use Boundless DAS (Wu et. al., 2023) to dynamically find a good dimension by learning the boundary. Here, we use Boundless DAS to find alignments for the name position information variable as well as the correct IO name variable. Very similar results, yet alignments with the IO name seems to be consistently better.
attn_input_data = find_variable_at(
    gpt2,
    tokenizer,
    [17],
    [i for i in range(12)],
    "attention_input",
    aligning_variable="position",  # now we are localizing the IO name
    do_boundless_das=True,
    debug=True,
)
block_input_data = find_variable_at(
    gpt2,
    tokenizer,
    [17],
    [i for i in range(12)],
    "block_input",
    aligning_variable="position",
    do_boundless_das=True,
    debug=True,
)
mlp_input_data = find_variable_at(
    gpt2,
    tokenizer,
    [17],
    [i for i in range(12)],
    "mlp_input",
    aligning_variable="position",
    do_boundless_das=True,
    debug=True,
)
mlp_act_data = find_variable_at(
    gpt2,
    tokenizer,
    [17],
    [i for i in range(12)],
    "mlp_activation",
    aligning_variable="position",
    do_boundless_das=True,
    debug=True,
)
attn_out_data = find_variable_at(
    gpt2,
    tokenizer,
    [17],
    [i for i in range(12)],
    "attention_output",
    aligning_variable="position",
    do_boundless_das=True,
    debug=True,
)
mlp_out_data = find_variable_at(
    gpt2,
    tokenizer,
    [17],
    [i for i in range(12)],
    "mlp_output",
    aligning_variable="position",
    do_boundless_das=True,
    debug=True,
)
attn_value_out_data = find_variable_at(
    gpt2,
    tokenizer,
    [17],
    [i for i in range(12)],
    "attention_value_output",
    aligning_variable="position",
    do_boundless_das=True,
    debug=True,
)
block_output_data = find_variable_at(
    gpt2,
    tokenizer,
    [17],
    [i for i in range(12)],
    "block_output",
    aligning_variable="position",
    do_boundless_das=True,
    debug=True,
)
# all_streams_io_name_df = pd.DataFrame(
#     block_output_data+
#     attn_out_data+mlp_out_data+
#     attn_value_out_data+mlp_act_data+
#     mlp_input_data+block_input_data+attn_input_data
# )
# all_streams_io_name_df.to_csv("./tutorial_data/all_streams_boundless_das_df.csv")
all_streams_df = pd.read_csv("./tutorial_data/all_streams_boundless_das_df.csv")
all_streams_df["IIA"] = all_streams_df["acc"]
df = all_streams_df[
    all_streams_df["stream"].isin(
        {
            "block_output",
            "attention_input",
            "attention_output",
            "attention_value_output",
        }
    )
].copy()
stream_labels = {
    "block_output": "Block Output",
    "attention_input": "Attention Input",
    "attention_output": "Attention Output\n(After Head Mixing)",
    "attention_value_output": "Attention Value Output\n(Before Head Mixing)",
}
df.loc[:, "stream"] = df["stream"].replace(stream_labels)


def custom_format(x):
    return f"{x:.2f}"


df.loc[:, "IIA_formatted"] = df["IIA"].map(custom_format)
other_locations_plot = (
    ggplot(df, aes(x="layer", y="IIA", color="stream"))
    + geom_line()
    + geom_point(size=2)
    + geom_text(
        aes(label="IIA_formatted"), nudge_y=0.01, size=8, va="bottom", show_legend=False
    )
    + theme_minimal()
    + ylim(0, 0.72)
    + theme(figure_size=(12, 3))
    + ggtitle("Name Position w/ Boundless DAS")
)

ggsave(
    other_locations_plot,
    filename="./tutorial_data/Boundless_DAS_other_locations_plot.pdf",
    dpi=200,
)
other_locations_plot
<Figure Size: (1200 x 300)>
all_streams_df = pd.read_csv("./tutorial_data/all_streams_boundless_das_df.csv")
all_streams_df["IIA"] = all_streams_df["acc"]
df = all_streams_df[
    all_streams_df["stream"].isin({"mlp_output", "mlp_input", "mlp_activation"})
].copy()
stream_labels = {
    "mlp_output": "MLP Output",
    "mlp_input": "MLP Input",
    "mlp_activation": "MLP Activations",
}
df["stream"] = df["stream"].replace(stream_labels)


def custom_format(x):
    return f"{x:.2f}"


df["IIA_formatted"] = df["IIA"].apply(custom_format)
all_mlp_locations_plot = (
    ggplot(df, aes(x="layer", y="IIA", color="stream"))
    + geom_line()
    + geom_point(size=2)
    + geom_text(
        aes(label="IIA_formatted"), nudge_y=0.01, size=8, va="bottom", show_legend=False
    )
    + theme_minimal()
    + ylim(0, 0.72)
    + theme(figure_size=(12, 3))
    + ggtitle("Name Position w/ Boundless DAS")
)

ggsave(
    all_mlp_locations_plot,
    filename="./tutorial_data/Boundless_DAS_all_mlp_locations_plot.pdf",
    dpi=200,
)
all_mlp_locations_plot
<Figure Size: (1200 x 300)>
attn_input_data = find_variable_at(
    gpt2,
    tokenizer,
    [17],
    [i for i in range(12)],
    "attention_input",
    aligning_variable="name",  # now we are localizing the IO name
    do_boundless_das=True,
    debug=True,
)
block_input_data = find_variable_at(
    gpt2,
    tokenizer,
    [17],
    [i for i in range(12)],
    "block_input",
    aligning_variable="name",
    do_boundless_das=True,
    debug=True,
)
mlp_input_data = find_variable_at(
    gpt2,
    tokenizer,
    [17],
    [i for i in range(12)],
    "mlp_input",
    aligning_variable="name",
    do_boundless_das=True,
    debug=True,
)
mlp_act_data = find_variable_at(
    gpt2,
    tokenizer,
    [17],
    [i for i in range(12)],
    "mlp_activation",
    aligning_variable="name",
    do_boundless_das=True,
    debug=True,
)
attn_out_data = find_variable_at(
    gpt2,
    tokenizer,
    [17],
    [i for i in range(12)],
    "attention_output",
    aligning_variable="name",
    do_boundless_das=True,
    debug=True,
)
mlp_out_data = find_variable_at(
    gpt2,
    tokenizer,
    [17],
    [i for i in range(12)],
    "mlp_output",
    aligning_variable="name",
    do_boundless_das=True,
    debug=True,
)
attn_value_out_data = find_variable_at(
    gpt2,
    tokenizer,
    [17],
    [i for i in range(12)],
    "attention_value_output",
    aligning_variable="name",
    do_boundless_das=True,
    debug=True,
)
block_output_data = find_variable_at(
    gpt2,
    tokenizer,
    [17],
    [i for i in range(12)],
    "block_output",
    aligning_variable="name",
    do_boundless_das=True,
    debug=True,
)
# all_streams_io_name_df = pd.DataFrame(
#     block_output_data+
#     attn_out_data+mlp_out_data+
#     attn_value_out_data+mlp_act_data+
#     mlp_input_data+block_input_data+attn_input_data
# )
# all_streams_io_name_df.to_csv("./tutorial_data/all_streams_io_name_boundless_das_df.csv")
all_streams_df = pd.read_csv("./tutorial_data/all_streams_io_name_boundless_das_df.csv")
all_streams_df["IIA"] = all_streams_df["acc"]
df = all_streams_df[
    all_streams_df["stream"].isin(
        {
            "block_output",
            "attention_input",
            "attention_output",
            "attention_value_output",
        }
    )
].copy()
stream_labels = {
    "block_output": "Block Output",
    "attention_input": "Attention Input",
    "attention_output": "Attention Output\n(After Head Mixing)",
    "attention_value_output": "Attention Value Output\n(Before Head Mixing)",
}
df.loc[:, "stream"] = df["stream"].replace(stream_labels)


def custom_format(x):
    return f"{x:.2f}"


df.loc[:, "IIA_formatted"] = df["IIA"].map(custom_format)
other_locations_plot = (
    ggplot(df, aes(x="layer", y="IIA", color="stream"))
    + geom_line()
    + geom_point(size=2)
    + geom_text(
        aes(label="IIA_formatted"), nudge_y=0.01, size=8, va="bottom", show_legend=False
    )
    + theme_minimal()
    + ylim(0, 1)
    + theme(figure_size=(12, 3))
    + ggtitle("Correct IO Name (20) w/ Boundless DAS")
)

ggsave(
    other_locations_plot,
    filename="./tutorial_data/Boundless_DAS_IO_name_other_locations_plot.pdf",
    dpi=200,
)
other_locations_plot
<Figure Size: (1200 x 300)>
all_streams_df = pd.read_csv("./tutorial_data/all_streams_io_name_boundless_das_df.csv")
all_streams_df["IIA"] = all_streams_df["acc"]
df = all_streams_df[
    all_streams_df["stream"].isin({"mlp_output", "mlp_input", "mlp_activation"})
].copy()
stream_labels = {
    "mlp_output": "MLP Output",
    "mlp_input": "MLP Input",
    "mlp_activation": "MLP Activations",
}
df["stream"] = df["stream"].replace(stream_labels)


def custom_format(x):
    return f"{x:.2f}"


df["IIA_formatted"] = df["IIA"].apply(custom_format)
all_mlp_locations_plot = (
    ggplot(df, aes(x="layer", y="IIA", color="stream"))
    + geom_line()
    + geom_point(size=2)
    + geom_text(
        aes(label="IIA_formatted"), nudge_y=0.01, size=8, va="bottom", show_legend=False
    )
    + theme_minimal()
    + ylim(0, 0.72)
    + theme(figure_size=(12, 3))
    + ggtitle("Correct IO Name (20) w/ Boundless DAS")
)

ggsave(
    all_mlp_locations_plot,
    filename="./tutorial_data/Boundless_DAS_IO_name_all_mlp_locations_plot.pdf",
    dpi=200,
)
all_mlp_locations_plot
<Figure Size: (1200 x 300)>
DAS and Boundless DAS weight matrix and head importance#
DAS-based methods learn a subspace that is a linear combination of axes in the original basis. Will the learned linear combination (i.e., the learned weights) interpretable by showing head’s importance when applied on top of the attention value output stream before the head mixing? In this section, we investigate this question for both DAS as well as Boundless DAS when aligning with the name position variable as well as the IO name variable.
_, boundless_das_intervenable = find_variable_at(
    gpt2,
    tokenizer,
    [17],
    [8],
    "attention_value_output",
    aligning_variable="position",
    do_boundless_das=True,
    return_intervenable=True,
    debug=True,
)
finding name position at: pos->17, layers->8, stream->attention_value_output
intervention = boundless_das_intervenable.interventions[
    "layer_8_repr_attention_value_output_unit_pos_nunit_1#0"
]
boundary_mask = sigmoid_boundary(
    intervention.intervention_population.repeat(1, 1),
    0.0,
    intervention.intervention_boundaries[0] * int(intervention.embed_dim),
    intervention.temperature,
)
learned_weights = (intervention.rotate_layer.weight * boundary_mask)[
    :, : math.ceil(intervention.intervention_boundaries[0] * 768)
]
headwise_learned_weights = torch.chunk(learned_weights, chunks=12, dim=0)

sampled_weights = [w.cpu().data.flatten().numpy() for w in headwise_learned_weights]

# Assuming your_list is your 2D list where each sublist is a NumPy array
df = pd.DataFrame(
    [
        (f"Head {i}", value)
        for i, sublist in enumerate(sampled_weights)
        for value in sublist
    ],
    columns=["Group", "Value"],
)
df["Group"] = pd.Categorical(
    df["Group"], categories=[f"Head {i}" for i in range(12)], ordered=True
)

# Plotting
boundless_das_weight_plot = (
    ggplot(df, aes(x="Value", fill="Group"))
    + geom_histogram(bins=30)
    + facet_wrap("~Group", ncol=3)
    + theme(  # Arrange in a grid with 3 columns
        legend_position="none", subplots_adjust={"wspace": 0.25, "hspace": 0.25}
    )
    + labs(x="Value", y="Count")
)
ggsave(
    boundless_das_weight_plot,
    filename="./tutorial_data/Boundless_DAS_weight_plot.pdf",
    dpi=200,
)
print(boundless_das_weight_plot)

_, das_intervenable = find_variable_at(
    gpt2,
    tokenizer,
    [17],
    [8],
    "attention_value_output",
    aligning_variable="position",
    return_intervenable=True,
    debug=True,
)
finding name position at: pos->17, layers->8, stream->attention_value_output
intervention = das_intervenable.interventions[
    "layer_8_repr_attention_value_output_unit_pos_nunit_1#0"
]
learned_weights = intervention.rotate_layer.weight
headwise_learned_weights = torch.chunk(learned_weights, chunks=12, dim=0)

sampled_weights = [w.cpu().data.flatten().numpy() for w in headwise_learned_weights]

df = pd.DataFrame(
    [
        (f"Head {i}", value)
        for i, sublist in enumerate(sampled_weights)
        for value in sublist
    ],
    columns=["Group", "Value"],
)
df["Group"] = pd.Categorical(
    df["Group"], categories=[f"Head {i}" for i in range(12)], ordered=True
)

# Plotting
das_weight_plot = (
    ggplot(df, aes(x="Value", fill="Group"))
    + geom_histogram(bins=30)
    + facet_wrap("~Group", ncol=3)
    + theme(  # Arrange in a grid with 3 columns
        legend_position="none", subplots_adjust={"wspace": 0.25, "hspace": 0.25}
    )
    + labs(x="Value", y="Count")
)
ggsave(das_weight_plot, filename="./tutorial_data/DAS_weight_plot.pdf", dpi=200)
print(das_weight_plot)

_, boundless_das_intervenable = find_variable_at(
    gpt2,
    tokenizer,
    [17],
    [9],
    "attention_value_output",
    aligning_variable="name",
    do_boundless_das=True,
    return_intervenable=True,
    debug=True,
)
finding name position at: pos->17, layers->9, stream->attention_value_output
intervention = boundless_das_intervenable.interventions[
    "layer_9_repr_attention_value_output_unit_pos_nunit_1#0"
]
boundary_mask = sigmoid_boundary(
    intervention.intervention_population.repeat(1, 1),
    0.0,
    intervention.intervention_boundaries[0] * int(intervention.embed_dim),
    intervention.temperature,
)
learned_weights = (intervention.rotate_layer.weight * boundary_mask)[
    :, : math.ceil(intervention.intervention_boundaries[0] * 768)
]
headwise_learned_weights = torch.chunk(learned_weights, chunks=12, dim=0)

sampled_weights = [w.cpu().data.flatten().numpy() for w in headwise_learned_weights]

# Assuming your_list is your 2D list where each sublist is a NumPy array
df = pd.DataFrame(
    [
        (f"Head {i}", value)
        for i, sublist in enumerate(sampled_weights)
        for value in sublist
    ],
    columns=["Group", "Value"],
)
df["Group"] = pd.Categorical(
    df["Group"], categories=[f"Head {i}" for i in range(12)], ordered=True
)

# Plotting
boundless_das_weight_plot = (
    ggplot(df, aes(x="Value", fill="Group"))
    + geom_histogram(bins=30)
    + facet_wrap("~Group", ncol=3)
    + theme(  # Arrange in a grid with 3 columns
        legend_position="none", subplots_adjust={"wspace": 0.25, "hspace": 0.25}
    )
    + labs(x="Value", y="Count")
)
ggsave(
    boundless_das_weight_plot,
    filename="./tutorial_data/Boundless_DAS_IO_name_weight_plot.pdf",
    dpi=200,
)
print(boundless_das_weight_plot)

_, das_intervenable = find_variable_at(
    gpt2,
    tokenizer,
    [17],
    [9],
    "attention_value_output",
    low_rank_dimension=20,
    aligning_variable="name",
    return_intervenable=True,
    debug=True,
)
finding name position at: pos->17, layers->9, stream->attention_value_output
intervention = das_intervenable.interventions[
    "layer_9_repr_attention_value_output_unit_pos_nunit_1#0"
]
learned_weights = intervention.rotate_layer.weight
headwise_learned_weights = torch.chunk(learned_weights, chunks=12, dim=0)

sampled_weights = [w.cpu().data.flatten().numpy() for w in headwise_learned_weights]

df = pd.DataFrame(
    [
        (f"Head {i}", value)
        for i, sublist in enumerate(sampled_weights)
        for value in sublist
    ],
    columns=["Group", "Value"],
)
df["Group"] = pd.Categorical(
    df["Group"], categories=[f"Head {i}" for i in range(12)], ordered=True
)

# Plotting
das_weight_plot = (
    ggplot(df, aes(x="Value", fill="Group"))
    + geom_histogram(bins=30)
    + facet_wrap("~Group", ncol=3)
    + theme(  # Arrange in a grid with 3 columns
        legend_position="none", subplots_adjust={"wspace": 0.25, "hspace": 0.25}
    )
    + labs(x="Value", y="Count")
)
ggsave(das_weight_plot, filename="./tutorial_data/DAS_IO_name_weight_plot.pdf", dpi=200)
print(das_weight_plot)

Findings: DAS learned weights map very well to head importance! In the plot above, we can see that Heads 6 and 10 have many non-zero entries, indicating that these neurons contribute significantly to aligning with the name position information. Boundless DAS shows a less salient result, suggesting that it learns a more distributed representation.